
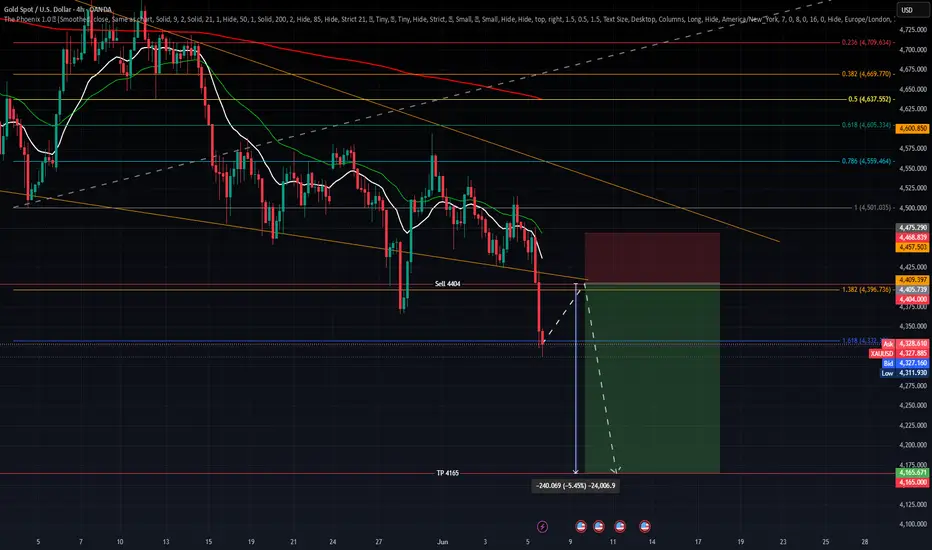
📊 TIMEFRAME: 4H
📍 ENTRY: 4,404
🔴 BIAS: Bearish
─────────────────────────────────────
THESIS
─────────────────────────────────────
Gold (XAUUSD) has been in a sustained bearish trend on the 4H chart, down over 9% across the visible range from the all-time high zone near 4,794. This trade targets a continuation of that trend following a precise rejection at a high-confluence sell level at 4,404.
─────────────────────────────────────
TECHNICAL CONFLUENCE
─────────────────────────────────────
1. FIBONACCI — 78.6% RETRACEMENT
The corrective rally from the swing low at 4,366 to the local swing high at 4,541 covered 175 points. The 78.6% Fibonacci retracement of that rally lands at 4,403.75 — within cents of the 4,404 sell level. This is the deepest valid retracement before a corrective rally becomes a reversal, making it the highest probability zone for a continuation sell.
2. PREVIOUS STRUCTURE — SUPPORT TURNED RESISTANCE
The 4,401–4,404 zone was previously a significant swing low and area of price consolidation. Once broken to the downside in the preceding bearish leg, this level flipped to overhead resistance. The retest of broken support as resistance is one of the most reliable patterns in technical analysis.
3. TREND ALIGNMENT — TMA STACK (Phoenix Algo)
All three Triangular Moving Averages are in full bearish alignment above price:
• Short TMA: 4,437
• Mid TMA: 4,468
• Long TMA: 4,637
Price selling at 4,404 was already beneath the TMA stack — confirming the sell was WITH the dominant trend, not against it.
4. VOLUME CONFIRMATION
The breakdown candle immediately following the 4,404 rejection printed 331,000+ volume — 2.6× the 4H average of ~127,000. Elevated volume on the break confirms institutional participation and validates the level.
─────────────────────────────────────
PRICE ACTION AT ENTRY
─────────────────────────────────────
The trigger candle wicked down to a low of 4,404.93 — essentially tagging the level to the pip — before closing at 4,406. The following candle opened at 4,406 and sold off 97 points to a low of 4,323, closing at 4,344. This sequence is a classic 'touch and reject' off confluence resistance.
─────────────────────────────────────
SETUP PROBABILITY
─────────────────────────────────────
Estimated: ~72%
Factors supporting the bear case:
✅ 78.6% Fibonacci precision hit
✅ Structure flip (support → resistance)
✅ Full TMA bearish stack confirmation
✅ 2.6× average volume on breakdown
✅ Trade aligned with dominant 4H downtrend
✅ Sharp rejection candle pattern at level
Risks to monitor:
⚠️ Potential consolidation/bounce from the 4,311 swing low area
⚠️ Any catalyst-driven reversal from key macro/fundamental events
⚠️ Failure to sustain below 4,350 would suggest weakening momentum
─────────────────────────────────────
LEVELS TO WATCH
─────────────────────────────────────
Resistance above (invalidation zones):
• 4,404 — entry / sell zone (must hold as resistance)
• 4,437 — Short TMA (dynamic resistance)
• 4,541 — swing high (full invalidation)
Support below (targets):
• 4,311 — current swing low
• 4,266 — next structure level
• 4,200 — extended target / psychological level
─────────────────────────────────────
NOTES
─────────────────────────────────────
This is not financial advice. All analysis is based on technical confluence only.
Always manage your risk and use a defined stop loss.
📍 ENTRY: 4,404
🔴 BIAS: Bearish
─────────────────────────────────────
THESIS
─────────────────────────────────────
Gold (XAUUSD) has been in a sustained bearish trend on the 4H chart, down over 9% across the visible range from the all-time high zone near 4,794. This trade targets a continuation of that trend following a precise rejection at a high-confluence sell level at 4,404.
─────────────────────────────────────
TECHNICAL CONFLUENCE
─────────────────────────────────────
1. FIBONACCI — 78.6% RETRACEMENT
The corrective rally from the swing low at 4,366 to the local swing high at 4,541 covered 175 points. The 78.6% Fibonacci retracement of that rally lands at 4,403.75 — within cents of the 4,404 sell level. This is the deepest valid retracement before a corrective rally becomes a reversal, making it the highest probability zone for a continuation sell.
2. PREVIOUS STRUCTURE — SUPPORT TURNED RESISTANCE
The 4,401–4,404 zone was previously a significant swing low and area of price consolidation. Once broken to the downside in the preceding bearish leg, this level flipped to overhead resistance. The retest of broken support as resistance is one of the most reliable patterns in technical analysis.
3. TREND ALIGNMENT — TMA STACK (Phoenix Algo)
All three Triangular Moving Averages are in full bearish alignment above price:
• Short TMA: 4,437
• Mid TMA: 4,468
• Long TMA: 4,637
Price selling at 4,404 was already beneath the TMA stack — confirming the sell was WITH the dominant trend, not against it.
4. VOLUME CONFIRMATION
The breakdown candle immediately following the 4,404 rejection printed 331,000+ volume — 2.6× the 4H average of ~127,000. Elevated volume on the break confirms institutional participation and validates the level.
─────────────────────────────────────
PRICE ACTION AT ENTRY
─────────────────────────────────────
The trigger candle wicked down to a low of 4,404.93 — essentially tagging the level to the pip — before closing at 4,406. The following candle opened at 4,406 and sold off 97 points to a low of 4,323, closing at 4,344. This sequence is a classic 'touch and reject' off confluence resistance.
─────────────────────────────────────
SETUP PROBABILITY
─────────────────────────────────────
Estimated: ~72%
Factors supporting the bear case:
✅ 78.6% Fibonacci precision hit
✅ Structure flip (support → resistance)
✅ Full TMA bearish stack confirmation
✅ 2.6× average volume on breakdown
✅ Trade aligned with dominant 4H downtrend
✅ Sharp rejection candle pattern at level
Risks to monitor:
⚠️ Potential consolidation/bounce from the 4,311 swing low area
⚠️ Any catalyst-driven reversal from key macro/fundamental events
⚠️ Failure to sustain below 4,350 would suggest weakening momentum
─────────────────────────────────────
LEVELS TO WATCH
─────────────────────────────────────
Resistance above (invalidation zones):
• 4,404 — entry / sell zone (must hold as resistance)
• 4,437 — Short TMA (dynamic resistance)
• 4,541 — swing high (full invalidation)
Support below (targets):
• 4,311 — current swing low
• 4,266 — next structure level
• 4,200 — extended target / psychological level
─────────────────────────────────────
NOTES
─────────────────────────────────────
This is not financial advice. All analysis is based on technical confluence only.
Always manage your risk and use a defined stop loss.

関連の投稿
免責事項
これらの情報および投稿は、TradingViewが提供または承認する金融、投資、取引、またはその他の種類の助言もしくは推奨であることを意図したものではなく、またこれらに該当するものでもありません。詳細は利用規約をご覧ください。
関連の投稿
免責事項
これらの情報および投稿は、TradingViewが提供または承認する金融、投資、取引、またはその他の種類の助言もしくは推奨であることを意図したものではなく、またこれらに該当するものでもありません。詳細は利用規約をご覧ください。