
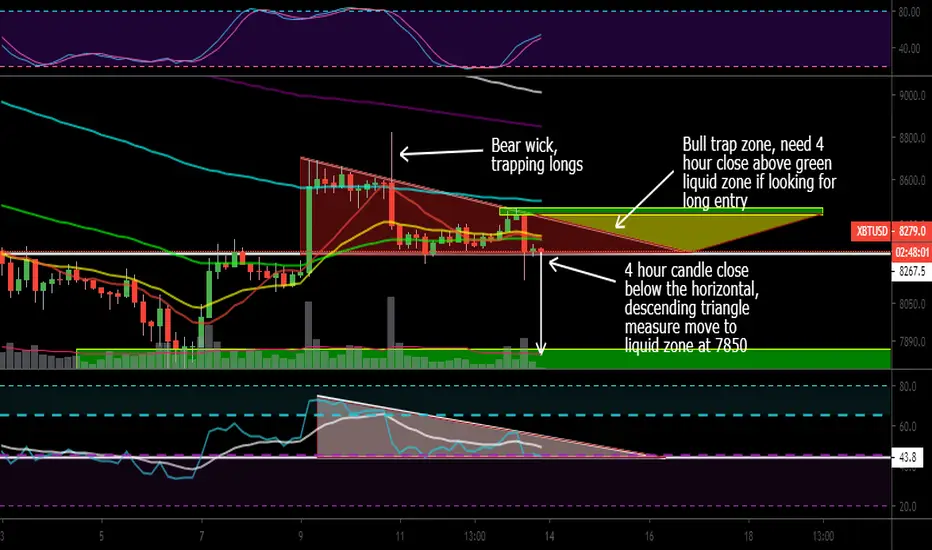
Bitcoin on the 4 hour timeframe is currently postured in a descending triangle. A 4 hour candle close below 8267 and the descending triangle measure move is down to the next liquid zone at 7850.
Currently, price is trading below all major moving averages. Red 10 SMA and yellow 21 EMA sloped down and acting as resistance, adding pressure to the downside.
4 hour stochastic is trending up, but weak and looking for a bearish crossover. Price action has been making lower highs while stochastics have been up, allowing for a bearish reset of the stochastics
4 hour RSI in a descending triangle, below the white RSI EMA. Consolidation on the edge of the RSI bearish control zone, likely to break to the downside. No divergence currently present
If this descending triangle plays out, please note how this will impact the higher timeframes. My higher timeframe analysis is found here:
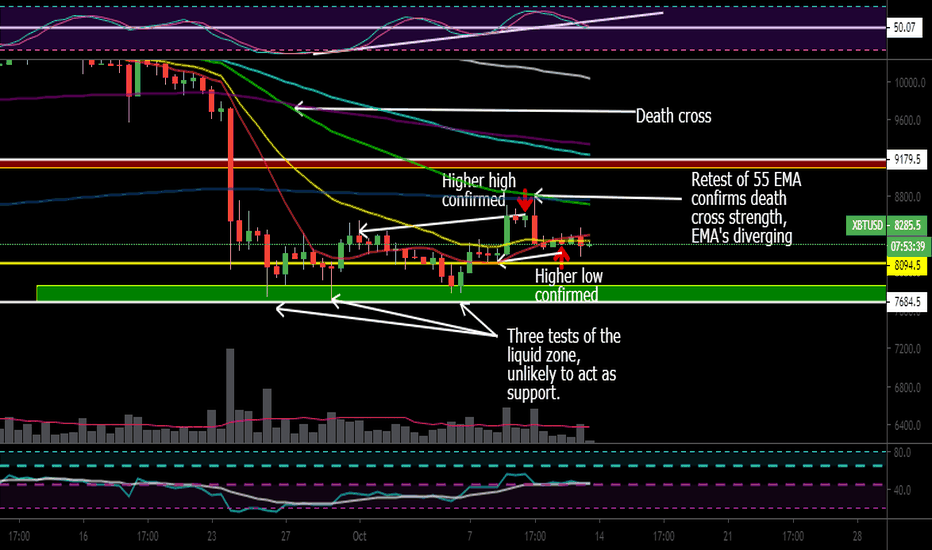
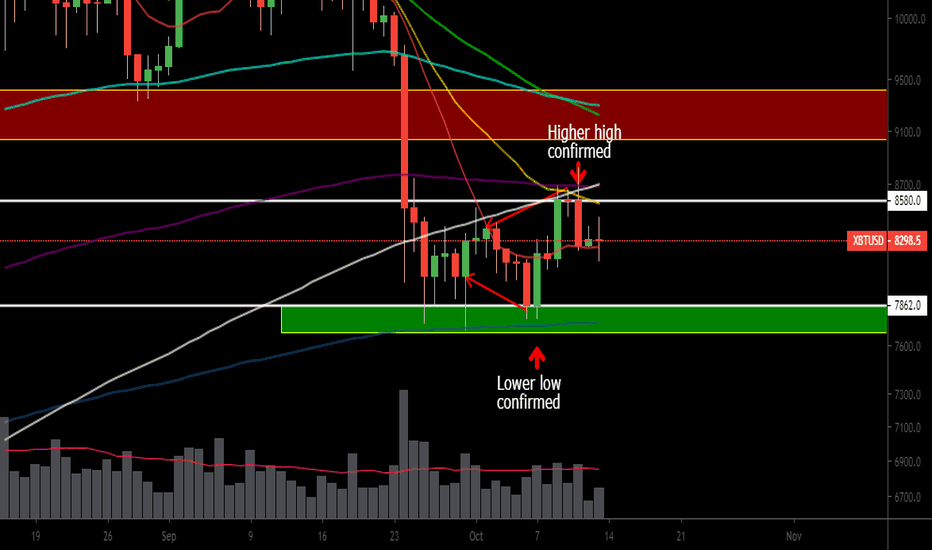
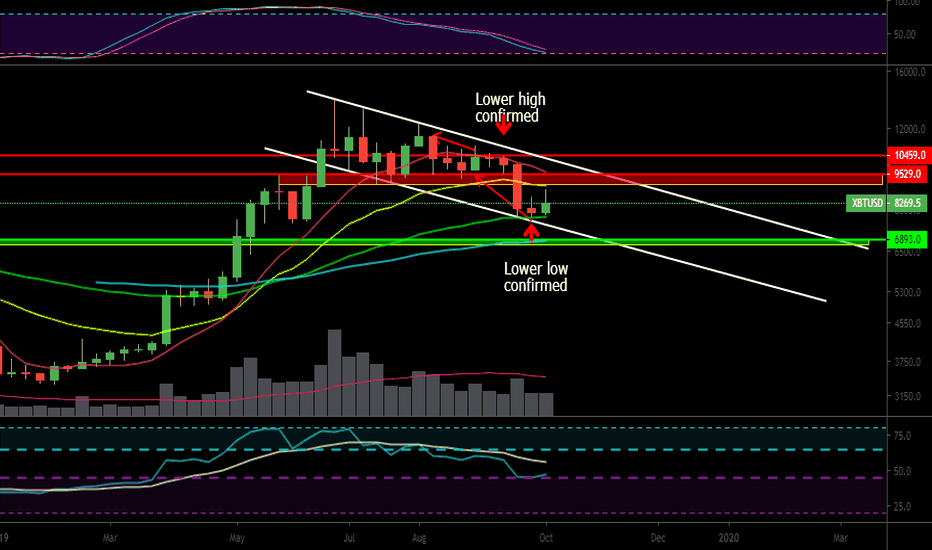
Currently, price is trading below all major moving averages. Red 10 SMA and yellow 21 EMA sloped down and acting as resistance, adding pressure to the downside.
4 hour stochastic is trending up, but weak and looking for a bearish crossover. Price action has been making lower highs while stochastics have been up, allowing for a bearish reset of the stochastics
4 hour RSI in a descending triangle, below the white RSI EMA. Consolidation on the edge of the RSI bearish control zone, likely to break to the downside. No divergence currently present
If this descending triangle plays out, please note how this will impact the higher timeframes. My higher timeframe analysis is found here:
トレード稼働中
Descending triangle closed a 4 hour candle below base horizontal. Currently, in a 4 hour downtrend. Going to test the liquid zone
関連の投稿
免責事項
これらの情報および投稿は、TradingViewが提供または承認する金融、投資、取引、またはその他の種類の助言もしくは推奨であることを意図したものではなく、またこれらに該当するものでもありません。詳細は利用規約をご覧ください。
関連の投稿
免責事項
これらの情報および投稿は、TradingViewが提供または承認する金融、投資、取引、またはその他の種類の助言もしくは推奨であることを意図したものではなく、またこれらに該当するものでもありません。詳細は利用規約をご覧ください。