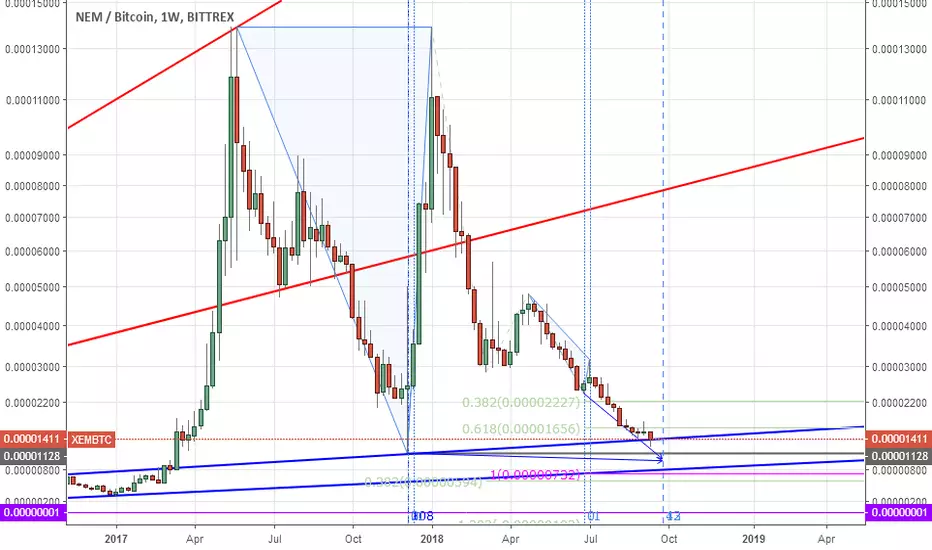
showing here the same possible reversal week 24-30 September. Ermanometry in case of XEM does not work however so precise in comparison to BTCUSD weekly chart (after all time high made by Bitcoin - before that time ermanometric calculations seem not to work properly). But XEMBTC chart suggests possible nearing of ending this bear market here. Some spike up should be drawed by market forces here. The only question is when.
ノート
XEMUSD have one week eralier his ermanometric, turning point. That from 13 August gave limited effect.
関連の投稿
免責事項
これらの情報および投稿は、TradingViewが提供または承認する金融、投資、取引、またはその他の種類の助言もしくは推奨であることを意図したものではなく、またこれらに該当するものでもありません。詳細は利用規約をご覧ください。
免責事項
これらの情報および投稿は、TradingViewが提供または承認する金融、投資、取引、またはその他の種類の助言もしくは推奨であることを意図したものではなく、またこれらに該当するものでもありません。詳細は利用規約をご覧ください。