更新済
NEM. Very interesting chart.
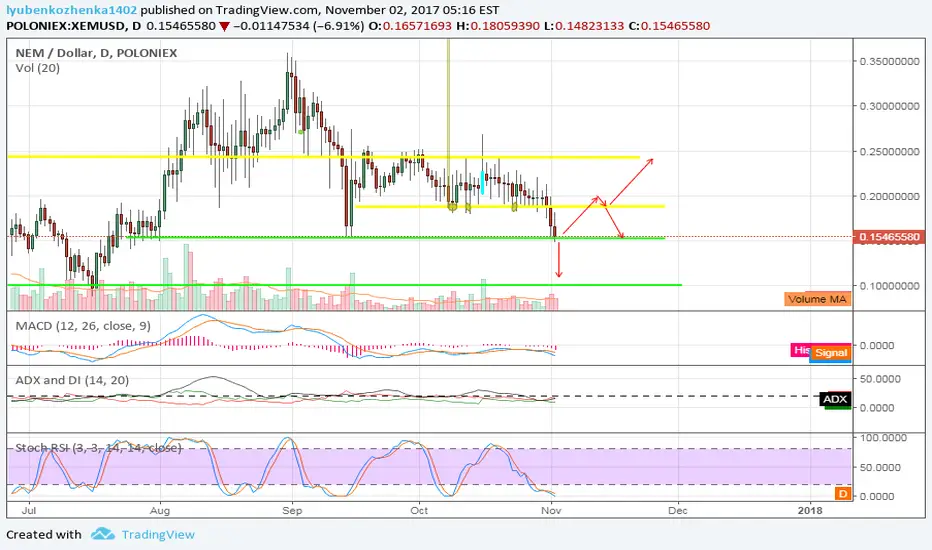
Very interesting chart.
perhaps there will be a reversal, and perhaps there will be a fall to 0.10.
A lot depends on which candle is next.
I will definitely update tomorrow. Perhaps earlier. Happy Trading
perhaps there will be a reversal, and perhaps there will be a fall to 0.10.
A lot depends on which candle is next.
I will definitely update tomorrow. Perhaps earlier. Happy Trading
トレード稼働中
I think that the price will go down. This is indicated by the RSI oscillator and also by two bear models of candlestick analysis.the first target is 0.152 and possibly 0.10 if the price breaks through support.
stop-loss at the level of 0.185
ノート
Now is a great time to open a buy order.The RSI oscillator is slightly higher than 50, the stochastic RSI and MACD makes the cross up.
Buy 0.185
Target 0.24
Stop Loss 0.17
トレード終了: 利益確定目標に到達

免責事項
これらの情報および投稿は、TradingViewが提供または承認する金融、投資、取引、またはその他の種類の助言もしくは推奨であることを意図したものではなく、またこれらに該当するものでもありません。詳細は利用規約をご覧ください。
免責事項
これらの情報および投稿は、TradingViewが提供または承認する金融、投資、取引、またはその他の種類の助言もしくは推奨であることを意図したものではなく、またこれらに該当するものでもありません。詳細は利用規約をご覧ください。