
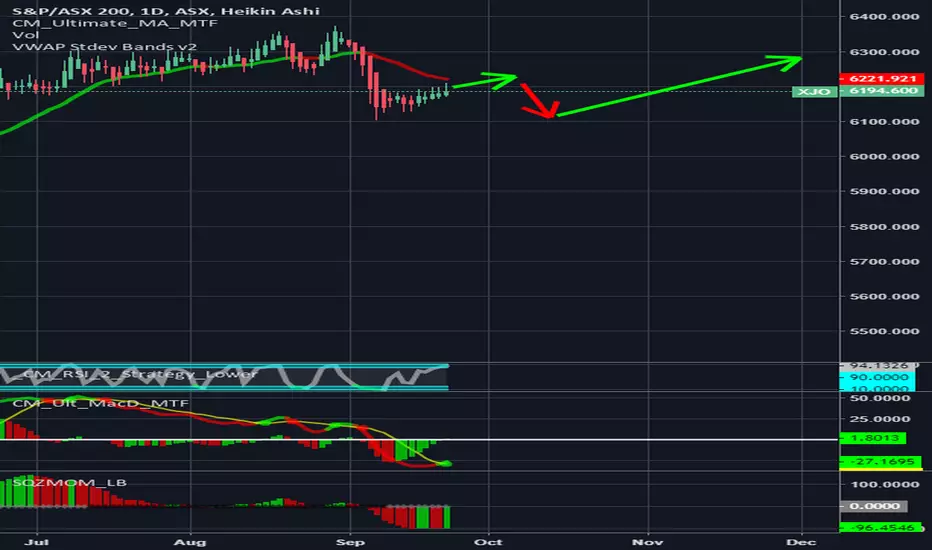
- Chris Moody's MacD indicator showing buy signal right now
- Squeeze Momentum showing it's in the good deal territory
- Candles are below the Chris Moody's MA
- As soon as you see 2 consecutive red candles on the 1 DAY Heikin Ashi chart for ASX:XJO, that's your stop loss, get out.
- ...otherwise I don't see why it can't hit 6300 even with one pullback.

免責事項
これらの情報および投稿は、TradingViewが提供または承認する金融、投資、取引、またはその他の種類の助言もしくは推奨であることを意図したものではなく、またこれらに該当するものでもありません。詳細は利用規約をご覧ください。
免責事項
これらの情報および投稿は、TradingViewが提供または承認する金融、投資、取引、またはその他の種類の助言もしくは推奨であることを意図したものではなく、またこれらに該当するものでもありません。詳細は利用規約をご覧ください。