
Sector: Communication Services (XLC)
Introduction:
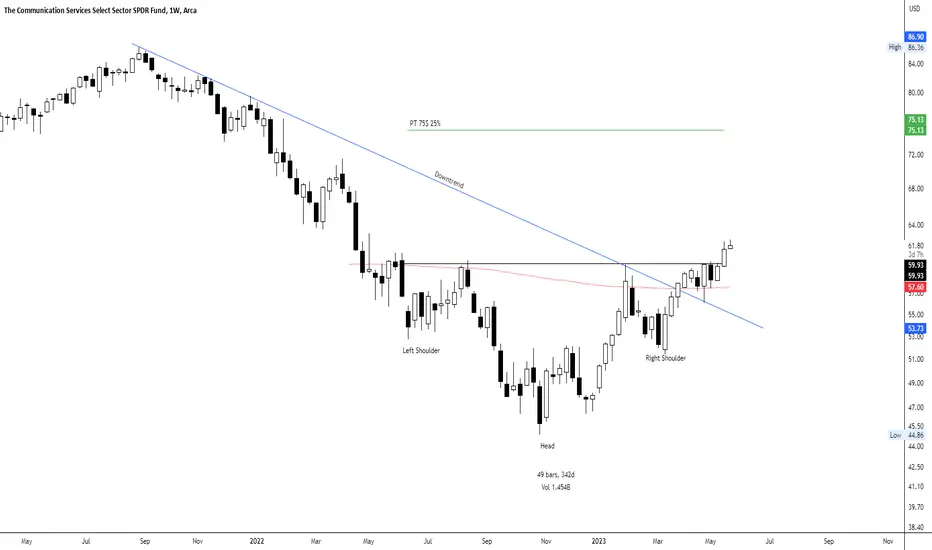
Hello everyone! Today, we're analyzing the weekly chart of the Communication Services Sector (XLC). After a clear downward trend, we observe a potentially bullish reversal marked by a variation of an inverted head and shoulders pattern.
Inverted Head and Shoulders Pattern:
Typically, an inverted head and shoulders pattern serves as a bullish reversal signal, suggesting a shift from a downtrend to an uptrend.
Analysis:
The XLC's price action has been forming a variation of an inverted head and shoulders pattern over the past 342 days. With a recent breakout above the horizontal neckline at $60, the price is decisively above the 200 EMA, supporting a bullish market environment.
The projected price target based on this pattern is $75, which equates to a potential increase of around 25%. From this analysis, we infer that the Communication Services Sector may outperform in the coming weeks or even months. Therefore, it might be worthwhile to pay closer attention to the individual stocks within this sector.
Conclusion:
The weekly chart of the XLC sector has shown a confirmed bullish reversal signaled by an inverted head and shoulders pattern. With a successful breakout above the neckline already in place, this could indicate a continuing bullish trend, suggesting that it may be an opportune time for long positions in this sector.
As we expect the Communication Services Sector to potentially outperform in the coming weeks or months, investors might consider focus on individual stocks within this sector for investment opportunities.
As always, your own research and risk management strategies should guide your investment decisions.
Thank you for tuning into this analysis. Don't forget to like, share, and follow for more insights into the market. Happy trading!
Best regards,
Karim Subhieh

KSC
免責事項
これらの情報および投稿は、TradingViewが提供または承認する金融、投資、取引、またはその他の種類の助言もしくは推奨であることを意図したものではなく、またこれらに該当するものでもありません。詳細は利用規約をご覧ください。
KSC
免責事項
これらの情報および投稿は、TradingViewが提供または承認する金融、投資、取引、またはその他の種類の助言もしくは推奨であることを意図したものではなく、またこれらに該当するものでもありません。詳細は利用規約をご覧ください。