
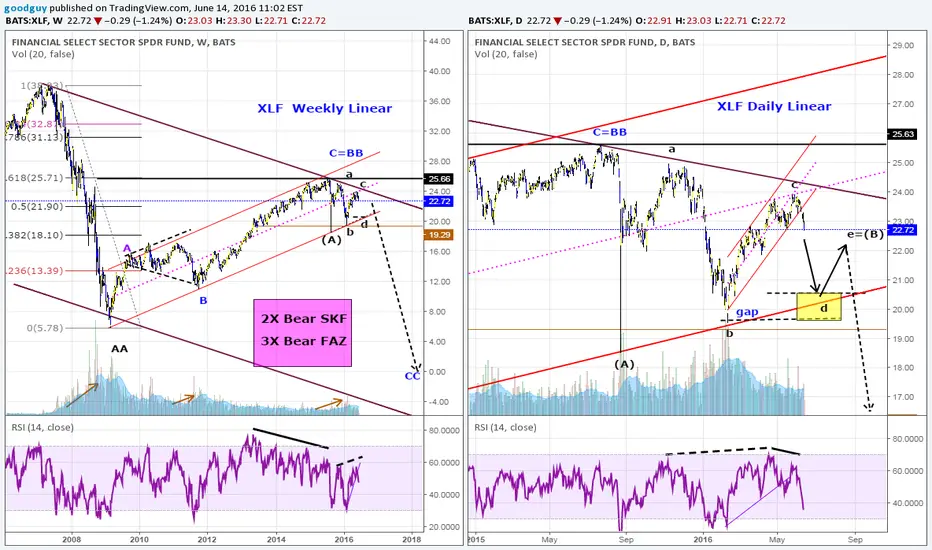
2 months ago I posted on XLF suggesting the top was likely in (see link below). As I review the recent price action I think it is is mostly likely forming a triangle before a final major drop. My intermediate term target is on the daily chart. I don't know if it will stop at the long term uptrend line or go on to close the gap. Take care. Good trading to you.
PS: Notice the nice channels. Also there is a negative reversal in the daily RSI followed by a bearish divergence which I have pointed out before often leads to lower lows.
PS: Notice the nice channels. Also there is a negative reversal in the daily RSI followed by a bearish divergence which I have pointed out before often leads to lower lows.

関連の投稿
免責事項
これらの情報および投稿は、TradingViewが提供または承認する金融、投資、取引、またはその他の種類の助言もしくは推奨であることを意図したものではなく、またこれらに該当するものでもありません。詳細は利用規約をご覧ください。
免責事項
これらの情報および投稿は、TradingViewが提供または承認する金融、投資、取引、またはその他の種類の助言もしくは推奨であることを意図したものではなく、またこれらに該当するものでもありません。詳細は利用規約をご覧ください。