ロング
XLM is Bullish
SWING TRADING ANALYSIS
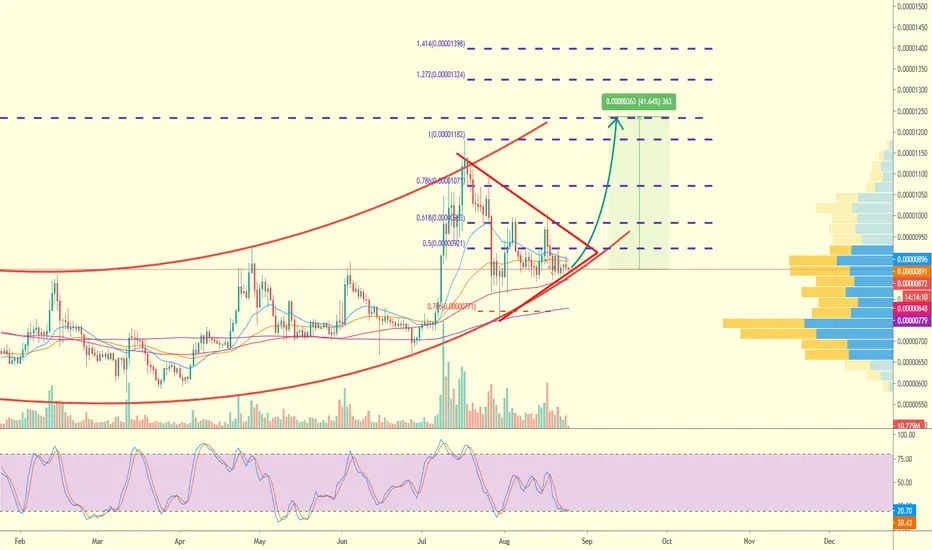
XLM in the bullish channel(red lines) right know, it can higher because the volume of accumulation is high in currently price, you can see it from the spike of volume profile
The decreasing of volume is a sign that it will pump in a days
The oscilator showed the price is currenctly low, that means it is oversold right know
Trading plan :
Entry : 850 - 890
Target 1 : 1074
Target 2 : 1186
Target 3 : 1238
Target 4 : 1328
Stop loss : 800
Enjoy the profit later 🤑🤑🤑
XLM in the bullish channel(red lines) right know, it can higher because the volume of accumulation is high in currently price, you can see it from the spike of volume profile
The decreasing of volume is a sign that it will pump in a days
The oscilator showed the price is currenctly low, that means it is oversold right know
Trading plan :
Entry : 850 - 890
Target 1 : 1074
Target 2 : 1186
Target 3 : 1238
Target 4 : 1328
Stop loss : 800
Enjoy the profit later 🤑🤑🤑

免責事項
これらの情報および投稿は、TradingViewが提供または承認する金融、投資、取引、またはその他の種類の助言もしくは推奨であることを意図したものではなく、またこれらに該当するものでもありません。詳細は利用規約をご覧ください。
免責事項
これらの情報および投稿は、TradingViewが提供または承認する金融、投資、取引、またはその他の種類の助言もしくは推奨であることを意図したものではなく、またこれらに該当するものでもありません。詳細は利用規約をご覧ください。