
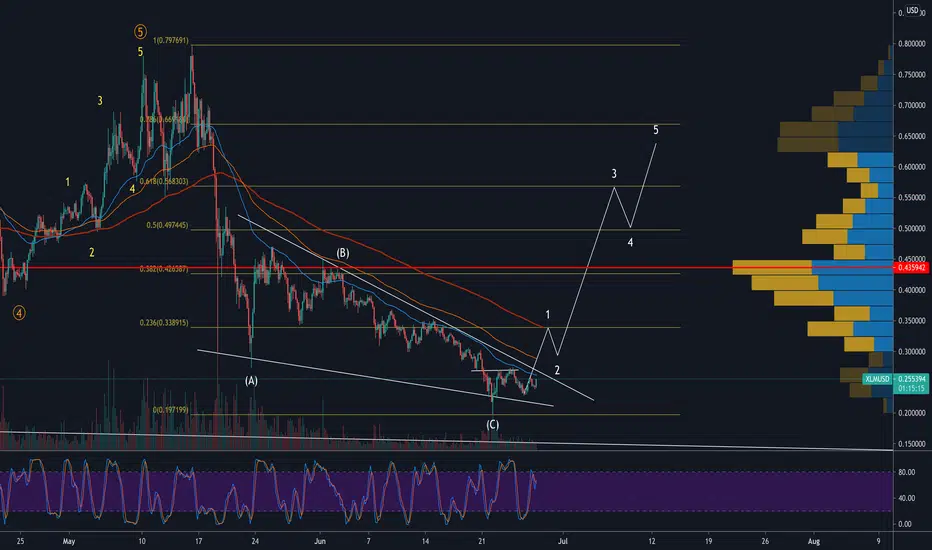
XLM- As stated in previous analysis XLM is and was a strong buy at .23-.25c Reasoning is that the chart is very clear and clean to me, after 5 waves up in the primary cycle XLM completed a near perfect ABC correction inside of a falling wedge pattern. A falling wedge pattern is very bullish pattern b c it show bearish selling exhaustion , meaning bears getting tired and the bulls can flip the trend very easily & quickly. Here is my EW projection going forward.

If your interested in joining my group DM me for the link. We do Elliot Wave TA give trade signals and set ups. We have channels for all cryptocurrency and also many OTC stocks. TY
免責事項
これらの情報および投稿は、TradingViewが提供または承認する金融、投資、取引、またはその他の種類の助言もしくは推奨であることを意図したものではなく、またこれらに該当するものでもありません。詳細は利用規約をご覧ください。
If your interested in joining my group DM me for the link. We do Elliot Wave TA give trade signals and set ups. We have channels for all cryptocurrency and also many OTC stocks. TY
免責事項
これらの情報および投稿は、TradingViewが提供または承認する金融、投資、取引、またはその他の種類の助言もしくは推奨であることを意図したものではなく、またこれらに該当するものでもありません。詳細は利用規約をご覧ください。