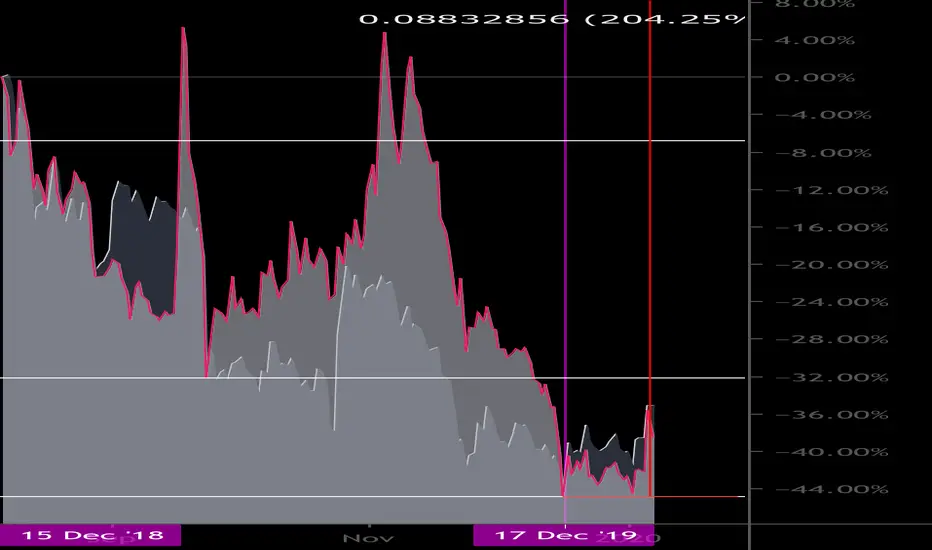
Fun chart to play around with. Xlmusd in foreground and Btcusd in background. White horizontal lines correspond to different Xlmusd accumulation phases that started in December ‘18.
Price should rise 200% from Dec ‘19 low.
Price should rise 200% from Dec ‘19 low.
ノート
For those interested, probable distribution that would form CNH when completed. Would make for some great growth.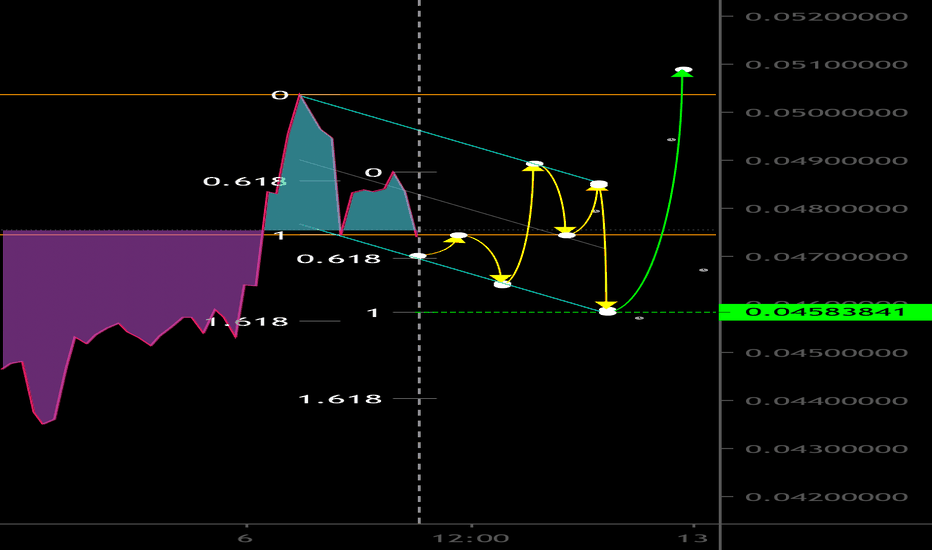
ノート
Btw, I based the 200% growth on this view of the chart:
関連の投稿
免責事項
これらの情報および投稿は、TradingViewが提供または承認する金融、投資、取引、またはその他の種類の助言もしくは推奨であることを意図したものではなく、またこれらに該当するものでもありません。詳細は利用規約をご覧ください。
免責事項
これらの情報および投稿は、TradingViewが提供または承認する金融、投資、取引、またはその他の種類の助言もしくは推奨であることを意図したものではなく、またこれらに該当するものでもありません。詳細は利用規約をご覧ください。