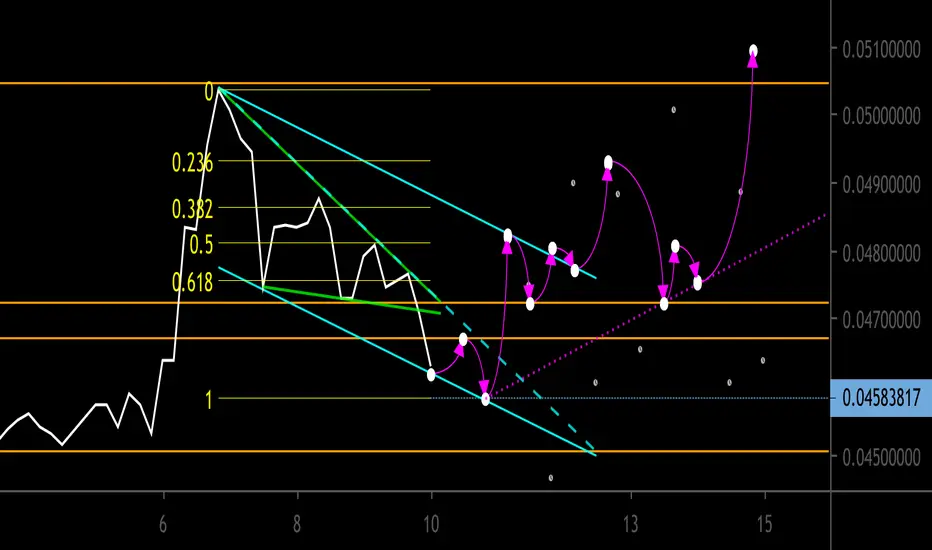
Green falling wedge broke down. I think price will follow blue wedge formed with the blue dashed trend line and bottom line of parallel channel. Potential forecast indicated with pink arrows and trend line. Timeline not to scale and intended to be part of forecast.
See main idea for more context.
See main idea for more context.
ノート
To clarify, the time line is not part of forecast.ノート
Possible that distribution has ended. Valid parallel channel, valid retracement, and volume peak on breakout of channel.ノート
As noted in related ideas, this pull back has been expected based on original distribution idea charts. However, looks like an accumulation pattern is ending. Will be bitcoin’s or XLM whale’s game on whether next XLM rally starts now or first attempts one last push down. Note 45 min timeframe shows a valid channel break (3 touches each side).ノート
Any tea drinkers?ノート
Maybe one last nudge to about .0476 to complete a five count C/Y down.ノート
If you want Xlm for USD then sell while you can. Else “hodl” to exchange for Btc. Btc wave 2 down target 7250. Will cause alt-Btc pairs to pump.ノート
Published an xlmbtc chart that is linked to below.
関連の投稿
免責事項
これらの情報および投稿は、TradingViewが提供または承認する金融、投資、取引、またはその他の種類の助言もしくは推奨であることを意図したものではなく、またこれらに該当するものでもありません。詳細は利用規約をご覧ください。
免責事項
これらの情報および投稿は、TradingViewが提供または承認する金融、投資、取引、またはその他の種類の助言もしくは推奨であることを意図したものではなく、またこれらに該当するものでもありません。詳細は利用規約をご覧ください。