
Stellar (XLM) technical analysis:
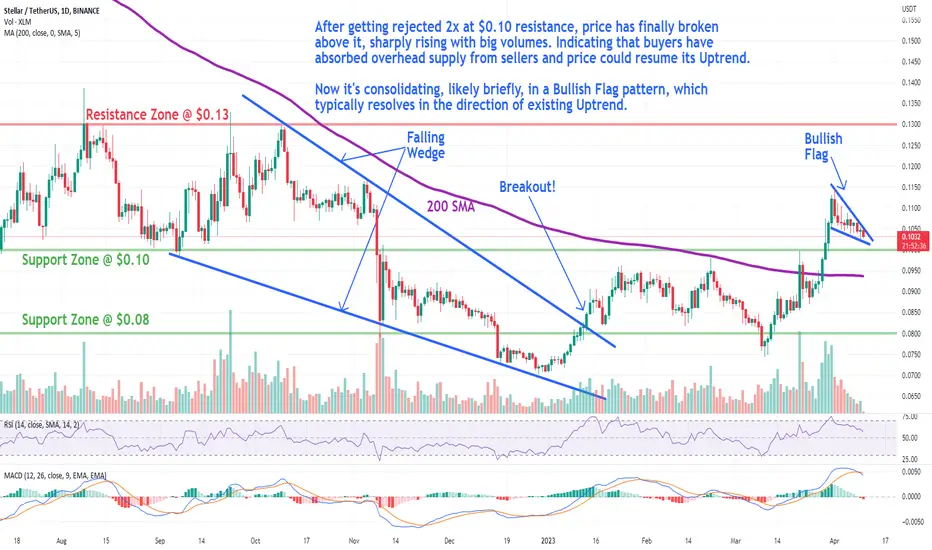
Trade setup: After getting rejected 2x at $0.10 resistance, price had finally broken above it, sharply rising with big volumes, indicating that buyers have absorbed overhead supply from sellers and price could resume its Uptrend. Now it’s consolidating, likely briefly, in a Bullish Flag pattern, which typically resolves in the direction of existing Uptrend.
Pattern: Bullish Flag pattern. Short term small rectangle trading range between diagonal parallel lines. It moves counter to the prevailing price trend observed in a longer time frame on a price chart. It forms typically following a sharp advance and often indicates a small change in direction (or areas of consolidation) before the previous trend resumes. Flag pattern is among the most reliable continuation patterns that traders use because it generates a setup for entering an existing trend that is ready to continue. Trade is initiated on a breakout, if it is in the same direction as the prevailing trend. Also, with bullish flag patterns, traders prefer a breakout with an increase in volume but it isn’t a must.
Trend: Uptrend across all time horizons (Short- Medium- and Long-Term).
Momentum is Mixed as MACD Line is below MACD Signal Line (Bearish) but RSI > 55 (Bullish).
Support and Resistance: Nearest Support Zone is $0.10 (previous resistance), then $0.08. The nearest Resistance Zone is $0.13.
Trade setup: After getting rejected 2x at $0.10 resistance, price had finally broken above it, sharply rising with big volumes, indicating that buyers have absorbed overhead supply from sellers and price could resume its Uptrend. Now it’s consolidating, likely briefly, in a Bullish Flag pattern, which typically resolves in the direction of existing Uptrend.
Pattern: Bullish Flag pattern. Short term small rectangle trading range between diagonal parallel lines. It moves counter to the prevailing price trend observed in a longer time frame on a price chart. It forms typically following a sharp advance and often indicates a small change in direction (or areas of consolidation) before the previous trend resumes. Flag pattern is among the most reliable continuation patterns that traders use because it generates a setup for entering an existing trend that is ready to continue. Trade is initiated on a breakout, if it is in the same direction as the prevailing trend. Also, with bullish flag patterns, traders prefer a breakout with an increase in volume but it isn’t a must.
Trend: Uptrend across all time horizons (Short- Medium- and Long-Term).
Momentum is Mixed as MACD Line is below MACD Signal Line (Bearish) but RSI > 55 (Bullish).
Support and Resistance: Nearest Support Zone is $0.10 (previous resistance), then $0.08. The nearest Resistance Zone is $0.13.

免責事項
これらの情報および投稿は、TradingViewが提供または承認する金融、投資、取引、またはその他の種類の助言もしくは推奨であることを意図したものではなく、またこれらに該当するものでもありません。詳細は利用規約をご覧ください。
免責事項
これらの情報および投稿は、TradingViewが提供または承認する金融、投資、取引、またはその他の種類の助言もしくは推奨であることを意図したものではなく、またこれらに該当するものでもありません。詳細は利用規約をご覧ください。