
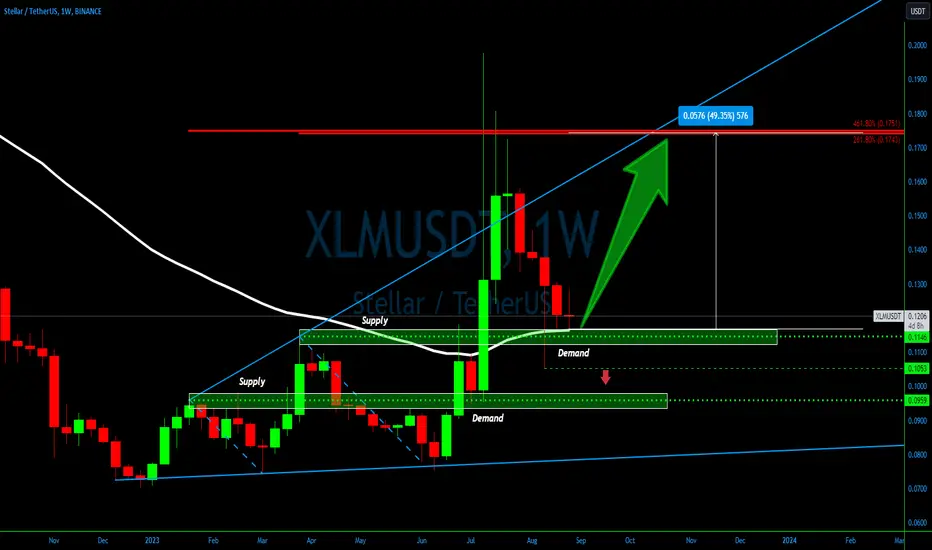
💎 Diving into #Stellar's long-term price trajectory, we spot some captivating patterns. The weekly #XLMUSDT chart reveals the price nestled in a robust demand zone, a magnet for buyers. Moreover, the 200 Exponential Moving Average has been consistently rebuffed in the past weeks.
💎 The bullish uptrend is evident with the formation of LLs and LHs. Given #XLM's position at support, it hints at a promising risk-reward scenario for bullish traders. As long as the price hovers above the current demand zone and crucially, remains north of the recent low at $0.1053, the scales tip towards an uptrend continuation.
💎 Eyeing the upside, a formidable resistance looms at $0.1750, marking a 50% surge from the present rate. This resistance's potency is amplified by a dual Fibonacci level, specifically at 261.8% and 461.8%. We could witness either a swift rally or an extended consolidation before #XLMUSDT ascends. In this volatile dance, patience and discipline remain our steadfast partners.

Want to trade like a PRO without the 15+ year learning curve?
🫳Steal the edge - follow seasoned team of traders at mycryptoparadise.com (FREE)
🎖️Or go full throttle with PRO strategy + killer entry/exit signals - t.me/MCPsupportbot
🫳Steal the edge - follow seasoned team of traders at mycryptoparadise.com (FREE)
🎖️Or go full throttle with PRO strategy + killer entry/exit signals - t.me/MCPsupportbot
関連の投稿
免責事項
これらの情報および投稿は、TradingViewが提供または承認する金融、投資、取引、またはその他の種類の助言もしくは推奨であることを意図したものではなく、またこれらに該当するものでもありません。詳細は利用規約をご覧ください。