
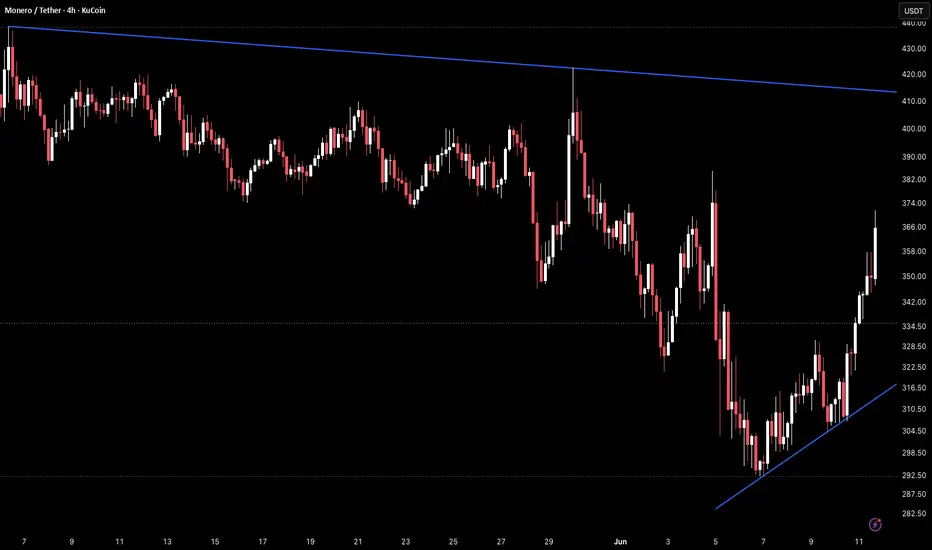
XMR on the 4H timeframe is currently trading around 366 after a sharp sell-off from the May range near 390–420 that pushed price down to a low near 292 before buyers stepped in and produced a strong recovery.
Price has been bouncing off a rising trendline from the June lows and is now pressing directly into the 366–370 horizontal resistance zone that had been a consistent support level throughout the prior range and has now flipped to resistance.
The descending resistance trendline from the May highs near 440 is also sitting overhead near 410–420, creating a clear ceiling structure above.
Key Levels To Watch
440 → Prior high, descending resistance origin
410–420 → Descending resistance trendline, major overhead ceiling
390–400 → Prior range support, now resistance
366–370 → Horizontal resistance, current test
342–350 → Prior support, now minor support below
304–316 → Rising trendline support (dynamic, climbing)
Below 282 → Full structure breakdown
The rising trendline from the June lows has been producing higher lows since the bottom near 292 and is now climbing toward 304–316. The current push toward 366–370 is the first significant resistance test since the recovery began.
A clean break and close above 370 would clear this horizontal resistance and open room toward 390–400 and the next resistance zone below the descending trendline.
Failure to break above 366–370 and a pullback below 342–350 shifts focus back to the rising trendline near 304–316 as the next key support.
This is a key resistance test following a trendline bounce.
Break above 370 → resistance cleared, eyes on 390–400.
Reject at 366–370 → pullback toward trendline at 304–316.
Structure recovering above rising trendline.
Bias shifts bearish only on trendline breakdown below 304.
Price has been bouncing off a rising trendline from the June lows and is now pressing directly into the 366–370 horizontal resistance zone that had been a consistent support level throughout the prior range and has now flipped to resistance.
The descending resistance trendline from the May highs near 440 is also sitting overhead near 410–420, creating a clear ceiling structure above.
Key Levels To Watch
440 → Prior high, descending resistance origin
410–420 → Descending resistance trendline, major overhead ceiling
390–400 → Prior range support, now resistance
366–370 → Horizontal resistance, current test
342–350 → Prior support, now minor support below
304–316 → Rising trendline support (dynamic, climbing)
Below 282 → Full structure breakdown
The rising trendline from the June lows has been producing higher lows since the bottom near 292 and is now climbing toward 304–316. The current push toward 366–370 is the first significant resistance test since the recovery began.
A clean break and close above 370 would clear this horizontal resistance and open room toward 390–400 and the next resistance zone below the descending trendline.
Failure to break above 366–370 and a pullback below 342–350 shifts focus back to the rising trendline near 304–316 as the next key support.
This is a key resistance test following a trendline bounce.
Break above 370 → resistance cleared, eyes on 390–400.
Reject at 366–370 → pullback toward trendline at 304–316.
Structure recovering above rising trendline.
Bias shifts bearish only on trendline breakdown below 304.

免責事項
これらの情報および投稿は、TradingViewが提供または承認する金融、投資、取引、またはその他の種類の助言もしくは推奨であることを意図したものではなく、またこれらに該当するものでもありません。詳細は利用規約をご覧ください。
免責事項
これらの情報および投稿は、TradingViewが提供または承認する金融、投資、取引、またはその他の種類の助言もしくは推奨であることを意図したものではなく、またこれらに該当するものでもありません。詳細は利用規約をご覧ください。