
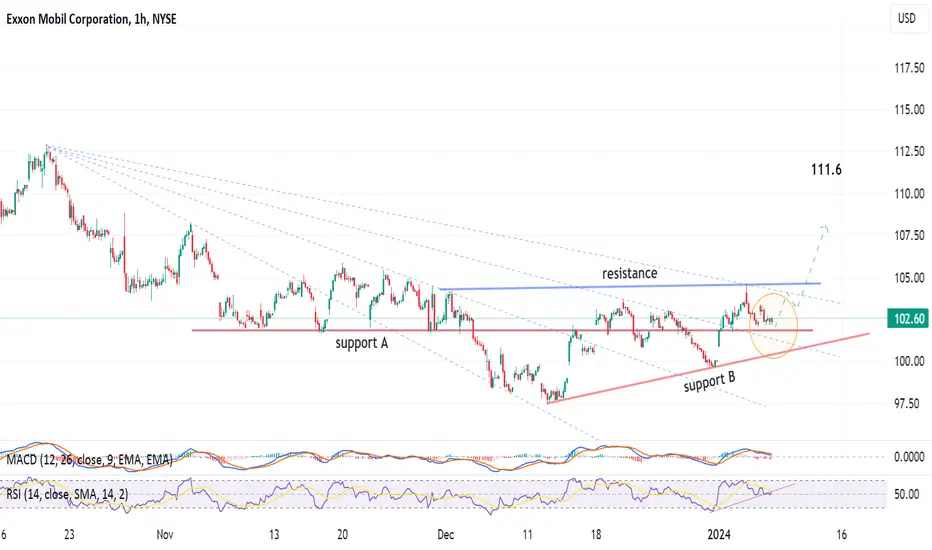
1-hour chart, the stock is trying to beat the resistance, but still does not have enough bullish power.
However, it seams it will rebound soon,and after crossing the resistance (blue line) around 104.7, the target will be 111.6 - A rising wedge chart pattern.
Below support A, the next down target will be support B line.
RSI is positive
However, it seams it will rebound soon,and after crossing the resistance (blue line) around 104.7, the target will be 111.6 - A rising wedge chart pattern.
Below support A, the next down target will be support B line.
RSI is positive

免責事項
これらの情報および投稿は、TradingViewが提供または承認する金融、投資、取引、またはその他の種類の助言もしくは推奨であることを意図したものではなく、またこれらに該当するものでもありません。詳細は利用規約をご覧ください。
免責事項
これらの情報および投稿は、TradingViewが提供または承認する金融、投資、取引、またはその他の種類の助言もしくは推奨であることを意図したものではなく、またこれらに該当するものでもありません。詳細は利用規約をご覧ください。