
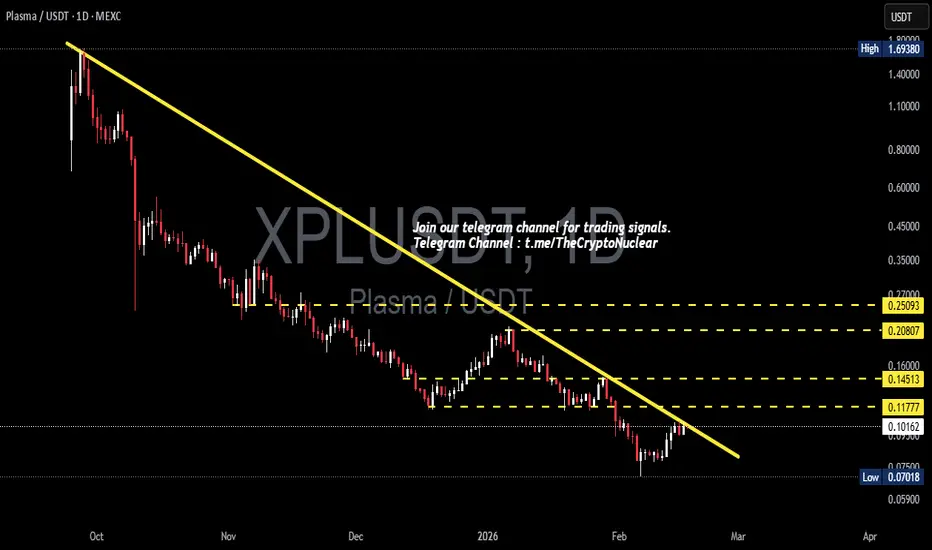
On the 1D timeframe, the price movement of XPL/USDT (Plasma) remains within a strong downtrend structure since the distribution phase at the previous top area.
Clearly visible sequences of:
Lower High
Lower Low
Dominant selling pressure
Weakening volume during retracements
The descending trendline acts as a major dynamic resistance that continues to suppress price movement.
Price is currently trading in the lower structure area — approaching a minor demand zone after printing a new low.
---
Pattern / Structure
The structures formed on the chart:
1. Descending Trendline
The downward trendline connects swing highs to subsequent swing highs → valid as dynamic resistance.
Validation characteristics:
Touched multiple times
Consistently triggers rejection
Stable downward angle
2. Bearish Continuation Structure
Price movement forms a pattern of:
Bearish impulse
Small sideways movement
Continued decline
This indicates a bearish continuation phase, not a reversal.
3. Base Formation (Early Accumulation) – Minor
In the latest low area, signs begin to appear:
Lower wick rejections
Long downside wicks
Narrow consolidation
However, it is still too early to classify this as a valid reversal.
---
Key Levels
Resistance
0.11777 → Minor / mid-range resistance
0.14513 → Strong supply
0.20807 → Breakout confirmation level
0.25093 → Major resistance / distribution zone
Support
0.10067 → Running support
0.07500 area → Demand zone
0.07018 → Swing low / last defense
---
Bullish Scenario
Bullish momentum is only valid if the following structure breaks:
Main triggers:
Break & close above the trendline
Break above 0.11777
Further confirmation:
1. Successful trendline retest
2. Formation of a higher low
3. Increasing volume
Upside targets:
0.14513
0.20807
0.25093
If 0.25093 breaks → the market structure could shift into a mid-term trend reversal.
---
Bearish Scenario
As long as price remains below the trendline → bearish bias remains dominant.
Potential scenarios:
1. Rejection at the trendline
2. Failure to reclaim 0.11777
3. Breakdown below 0.10067
Downside targets:
0.07500
0.07018 (current low)
If 0.07018 breaks → high probability of entering downside price discovery (new ATL).
---
Conclusion
Main trend: Bearish
Structure: Lower High – Lower Low
Key resistance: Trendline + 0.11777
Current area: Lower demand / minor base
The market is currently at a critical phase:
Break the trendline → reversal potential
Rejection → continuation lower
In other words:
This is a decision zone for the next major move.
#XPLUSDT #XPL #CryptoAnalysis #TechnicalAnalysis #AltcoinSetup #Downtrend #TrendlineBreak #CryptoTrading #SupportResistance
Clearly visible sequences of:
Lower High
Lower Low
Dominant selling pressure
Weakening volume during retracements
The descending trendline acts as a major dynamic resistance that continues to suppress price movement.
Price is currently trading in the lower structure area — approaching a minor demand zone after printing a new low.
---
Pattern / Structure
The structures formed on the chart:
1. Descending Trendline
The downward trendline connects swing highs to subsequent swing highs → valid as dynamic resistance.
Validation characteristics:
Touched multiple times
Consistently triggers rejection
Stable downward angle
2. Bearish Continuation Structure
Price movement forms a pattern of:
Bearish impulse
Small sideways movement
Continued decline
This indicates a bearish continuation phase, not a reversal.
3. Base Formation (Early Accumulation) – Minor
In the latest low area, signs begin to appear:
Lower wick rejections
Long downside wicks
Narrow consolidation
However, it is still too early to classify this as a valid reversal.
---
Key Levels
Resistance
0.11777 → Minor / mid-range resistance
0.14513 → Strong supply
0.20807 → Breakout confirmation level
0.25093 → Major resistance / distribution zone
Support
0.10067 → Running support
0.07500 area → Demand zone
0.07018 → Swing low / last defense
---
Bullish Scenario
Bullish momentum is only valid if the following structure breaks:
Main triggers:
Break & close above the trendline
Break above 0.11777
Further confirmation:
1. Successful trendline retest
2. Formation of a higher low
3. Increasing volume
Upside targets:
0.14513
0.20807
0.25093
If 0.25093 breaks → the market structure could shift into a mid-term trend reversal.
---
Bearish Scenario
As long as price remains below the trendline → bearish bias remains dominant.
Potential scenarios:
1. Rejection at the trendline
2. Failure to reclaim 0.11777
3. Breakdown below 0.10067
Downside targets:
0.07500
0.07018 (current low)
If 0.07018 breaks → high probability of entering downside price discovery (new ATL).
---
Conclusion
Main trend: Bearish
Structure: Lower High – Lower Low
Key resistance: Trendline + 0.11777
Current area: Lower demand / minor base
The market is currently at a critical phase:
Break the trendline → reversal potential
Rejection → continuation lower
In other words:
This is a decision zone for the next major move.
#XPLUSDT #XPL #CryptoAnalysis #TechnicalAnalysis #AltcoinSetup #Downtrend #TrendlineBreak #CryptoTrading #SupportResistance

✅ Get Free Signals! Join Our Telegram Channel Here: t.me/TheCryptoNuclear
✅ Twitter: twitter.com/crypto_nuclear
✅ Join Bybit : partner.bybit.com/b/nuclearvip
✅ Benefits : Lifetime Trading Fee Discount -50%
✅ Twitter: twitter.com/crypto_nuclear
✅ Join Bybit : partner.bybit.com/b/nuclearvip
✅ Benefits : Lifetime Trading Fee Discount -50%
免責事項
これらの情報および投稿は、TradingViewが提供または承認する金融、投資、取引、またはその他の種類の助言もしくは推奨であることを意図したものではなく、またこれらに該当するものでもありません。詳細は利用規約をご覧ください。
✅ Get Free Signals! Join Our Telegram Channel Here: t.me/TheCryptoNuclear
✅ Twitter: twitter.com/crypto_nuclear
✅ Join Bybit : partner.bybit.com/b/nuclearvip
✅ Benefits : Lifetime Trading Fee Discount -50%
✅ Twitter: twitter.com/crypto_nuclear
✅ Join Bybit : partner.bybit.com/b/nuclearvip
✅ Benefits : Lifetime Trading Fee Discount -50%
免責事項
これらの情報および投稿は、TradingViewが提供または承認する金融、投資、取引、またはその他の種類の助言もしくは推奨であることを意図したものではなく、またこれらに該当するものでもありません。詳細は利用規約をご覧ください。