
📊⚡ Technical Analysis — XPL/USDT
💵 Coin: XPL
⌛ Time Frame: 2D
📐 Structure: Descending Triangle / Descending Resistance Structure
🎯 Major Support: $0.072 – $0.082 🟨
📍 Current Price Area: ~$0.086
🔻 Major Trendline Resistance: Around $0.095–$0.100 and gradually declining over time
---
🔻📐 1. Descending Trendline — Major Resistance
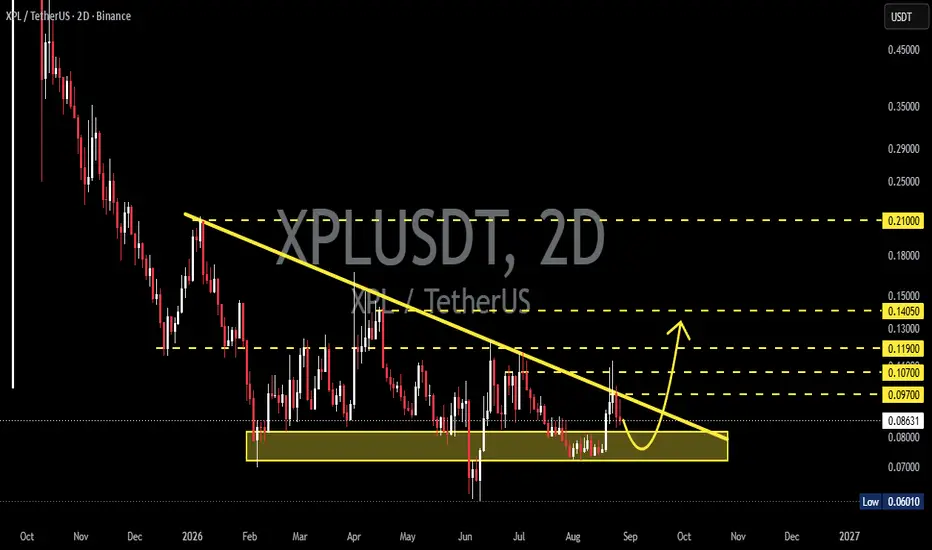
The descending yellow trendline represents the main dynamic resistance 📉🔻 on the chart.
Since the rejection from around $0.21, XPL has continued forming a lower-high structure 📉, with major recovery attempts repeatedly being capped by this trendline.
📉 As long as price has not successfully broken out 🚀 and closed strongly above the trendline, the bearish/neutral structure remains valid.
However, the more frequently price tests the resistance without creating a significant new low, the greater the possibility of a breakout ⚡🚀 if buyers eventually take control of momentum.
---
🟨🛡️ 2. Major Demand Zone — $0.072–$0.082
This is the MOST IMPORTANT 🔥 area on the chart.
🟨 Demand / Support Zone: $0.072 – $0.082
Price has entered this area multiple times and received a bullish response 🟢📈.
During August, XPL once again defended the area around $0.074–$0.080, before rebounding toward $0.09–$0.10.
💡 As long as $0.072–$0.082 🟨 continues to hold, the structure still has the potential to develop into a bullish reversal 🚀📈.
---
🟢🚀 BULLISH SCENARIO
🚀📈 Breakout Above the Descending Trendline
The bullish scenario becomes significantly more interesting if XPL manages to:
1️⃣ 🚀 Break out of the descending trendline
⬇️
2️⃣ 🕯️ Close a 2D candle above the resistance
⬇️
3️⃣ 🔄 Retest the trendline and successfully hold it as support
⬇️
4️⃣ 📈 Continue forming higher highs
If the breakout is confirmed, the next horizontal resistance areas become potential targets:
🎯 $0.097 — First Resistance
🎯 $0.107 — Second Resistance
🎯 $0.119 — Major Resistance
🎯 $0.1405 — Major Breakout Target
🎯 $0.2100 — Major Historical Resistance
📌 These levels correspond to the horizontal resistance levels marked on the chart.
📈 $0.097–$0.107 will be the first important area to determine whether the breakout has sufficient momentum.
🔥 If XPL successfully breaks above $0.119, the bullish structure will become significantly stronger, potentially opening the way toward $0.1405.
🚀 Meanwhile, reclaiming $0.1405 would represent a much more significant structural change, as price would begin entering a major previous resistance area.
---
🔴⚠️ BEARISH SCENARIO
⚠️📉 Rejection from the Descending Trendline
The bearish scenario remains valid if price gets rejected again by the descending trendline.
If XPL fails to break resistance and moves lower again:
🔻 $0.097 → rejection
🔻 $0.086 → loss of rebound momentum
🔻 $0.082 → loss of the upper part of the demand zone
The most critical level is:
🚨🔻 $0.072
If a breakdown 📉 occurs with a 2D close below $0.072, the $0.072–$0.082 🟨 demand zone would be considered invalidated.
This could open the possibility of a retest toward:
🔻 $0.0601 — previous major low visible on the chart.
🚨 A breakdown below $0.0601 would make the bearish structure significantly more aggressive and could potentially lead to the search for a new support area below this level.
---
📐🔻 PATTERN — DESCENDING TRIANGLE
The structure on the chart strongly resembles a Descending Triangle 🔻📐, characterized by:
🔻 Lower highs forming beneath the descending trendline.
🟨 Horizontal support located around $0.072–$0.082.
🔄 Price becoming increasingly compressed ⚡ between declining resistance and support.
💥 This type of compression can eventually produce a strong expansion move 🚀📉 once either side is decisively broken.
🔥 What makes the current setup interesting is that price is currently above the demand zone 🟨 but still below the descending resistance 🔻.
🎯 This means XPL is currently approaching a DECISION POINT ⚖️🔥.
---
🧠📊 KEY LEVELS TO WATCH
Level Function
🟢🛡️ $0.072–$0.082 Major Demand / Support
⚪📍 ~$0.086 Current Price Area
🔴📐 ~$0.097–$0.100 Descending Trendline / Initial Resistance
🔴🎯 $0.107 Resistance
🔴🚧 $0.119 Major Resistance
🟠🔥 $0.1405 Major Resistance / Breakout Level
🟡🚀 $0.2100 Major Historical Resistance
🚨🔻 $0.0601 Major Low / Bearish Breakdown Reference
---
⚖️🔥 CONCLUSION
📊 XPL is currently in a compression phase ⚡ between the descending trendline 🔻 and the major demand zone 🟨.
🟢🚀 Bullish:
If XPL manages to break out of the descending trendline 📈 and successfully completes a 2D close + successful retest 🔄, the potential recovery toward:
🎯 $0.097 → $0.107 → $0.119 → $0.1405
becomes increasingly likely.
🔴📉 Bearish:
If price continues to be rejected by the trendline and eventually breaks down below $0.072 🚨, the descending triangle structure could develop into a bearish continuation 📉, with the next major area of interest around:
🎯 $0.0601
---
🎯🔥 MOST IMPORTANT LEVELS
🟨 $0.072–$0.082 = Major Support / Demand Zone
🔻 ~$0.097–$0.100 = Major Breakout Resistance
⚖️ As long as price remains between these two areas, XPL is still in a compression phase and the next direction has not been fully confirmed.
🚀 Breakout + 2D Close + Retest = Bullish Confirmation
🚨 Breakdown + 2D Close Below $0.072 = Bearish Confirmation
> ⚠️ As long as price remains between these two areas, XPL is still in a compression phase and the next direction has not been fully confirmed. A breakout or breakdown confirmed by a 2D candle close would provide a much stronger confirmation of the next major move.
#XPL #Plasma #XPLUSDT #Crypto #CryptoAnalysis #TechnicalAnalysis #Altcoins #AltcoinAnalysis #CryptoTrading #PriceAction #Breakout
💵 Coin:
XPL⌛ Time Frame: 2D
📐 Structure: Descending Triangle / Descending Resistance Structure
🎯 Major Support: $0.072 – $0.082 🟨
📍 Current Price Area: ~$0.086
🔻 Major Trendline Resistance: Around $0.095–$0.100 and gradually declining over time
---
🔻📐 1. Descending Trendline — Major Resistance
The descending yellow trendline represents the main dynamic resistance 📉🔻 on the chart.
Since the rejection from around $0.21, XPL has continued forming a lower-high structure 📉, with major recovery attempts repeatedly being capped by this trendline.
📉 As long as price has not successfully broken out 🚀 and closed strongly above the trendline, the bearish/neutral structure remains valid.
However, the more frequently price tests the resistance without creating a significant new low, the greater the possibility of a breakout ⚡🚀 if buyers eventually take control of momentum.
---
🟨🛡️ 2. Major Demand Zone — $0.072–$0.082
This is the MOST IMPORTANT 🔥 area on the chart.
🟨 Demand / Support Zone: $0.072 – $0.082
Price has entered this area multiple times and received a bullish response 🟢📈.
During August, XPL once again defended the area around $0.074–$0.080, before rebounding toward $0.09–$0.10.
💡 As long as $0.072–$0.082 🟨 continues to hold, the structure still has the potential to develop into a bullish reversal 🚀📈.
---
🟢🚀 BULLISH SCENARIO
🚀📈 Breakout Above the Descending Trendline
The bullish scenario becomes significantly more interesting if XPL manages to:
1️⃣ 🚀 Break out of the descending trendline
⬇️
2️⃣ 🕯️ Close a 2D candle above the resistance
⬇️
3️⃣ 🔄 Retest the trendline and successfully hold it as support
⬇️
4️⃣ 📈 Continue forming higher highs
If the breakout is confirmed, the next horizontal resistance areas become potential targets:
🎯 $0.097 — First Resistance
🎯 $0.107 — Second Resistance
🎯 $0.119 — Major Resistance
🎯 $0.1405 — Major Breakout Target
🎯 $0.2100 — Major Historical Resistance
📌 These levels correspond to the horizontal resistance levels marked on the chart.
📈 $0.097–$0.107 will be the first important area to determine whether the breakout has sufficient momentum.
🔥 If XPL successfully breaks above $0.119, the bullish structure will become significantly stronger, potentially opening the way toward $0.1405.
🚀 Meanwhile, reclaiming $0.1405 would represent a much more significant structural change, as price would begin entering a major previous resistance area.
---
🔴⚠️ BEARISH SCENARIO
⚠️📉 Rejection from the Descending Trendline
The bearish scenario remains valid if price gets rejected again by the descending trendline.
If XPL fails to break resistance and moves lower again:
🔻 $0.097 → rejection
🔻 $0.086 → loss of rebound momentum
🔻 $0.082 → loss of the upper part of the demand zone
The most critical level is:
🚨🔻 $0.072
If a breakdown 📉 occurs with a 2D close below $0.072, the $0.072–$0.082 🟨 demand zone would be considered invalidated.
This could open the possibility of a retest toward:
🔻 $0.0601 — previous major low visible on the chart.
🚨 A breakdown below $0.0601 would make the bearish structure significantly more aggressive and could potentially lead to the search for a new support area below this level.
---
📐🔻 PATTERN — DESCENDING TRIANGLE
The structure on the chart strongly resembles a Descending Triangle 🔻📐, characterized by:
🔻 Lower highs forming beneath the descending trendline.
🟨 Horizontal support located around $0.072–$0.082.
🔄 Price becoming increasingly compressed ⚡ between declining resistance and support.
💥 This type of compression can eventually produce a strong expansion move 🚀📉 once either side is decisively broken.
🔥 What makes the current setup interesting is that price is currently above the demand zone 🟨 but still below the descending resistance 🔻.
🎯 This means XPL is currently approaching a DECISION POINT ⚖️🔥.
---
🧠📊 KEY LEVELS TO WATCH
Level Function
🟢🛡️ $0.072–$0.082 Major Demand / Support
⚪📍 ~$0.086 Current Price Area
🔴📐 ~$0.097–$0.100 Descending Trendline / Initial Resistance
🔴🎯 $0.107 Resistance
🔴🚧 $0.119 Major Resistance
🟠🔥 $0.1405 Major Resistance / Breakout Level
🟡🚀 $0.2100 Major Historical Resistance
🚨🔻 $0.0601 Major Low / Bearish Breakdown Reference
---
⚖️🔥 CONCLUSION
📊 XPL is currently in a compression phase ⚡ between the descending trendline 🔻 and the major demand zone 🟨.
🟢🚀 Bullish:
If XPL manages to break out of the descending trendline 📈 and successfully completes a 2D close + successful retest 🔄, the potential recovery toward:
🎯 $0.097 → $0.107 → $0.119 → $0.1405
becomes increasingly likely.
🔴📉 Bearish:
If price continues to be rejected by the trendline and eventually breaks down below $0.072 🚨, the descending triangle structure could develop into a bearish continuation 📉, with the next major area of interest around:
🎯 $0.0601
---
🎯🔥 MOST IMPORTANT LEVELS
🟨 $0.072–$0.082 = Major Support / Demand Zone
🔻 ~$0.097–$0.100 = Major Breakout Resistance
⚖️ As long as price remains between these two areas, XPL is still in a compression phase and the next direction has not been fully confirmed.
🚀 Breakout + 2D Close + Retest = Bullish Confirmation
🚨 Breakdown + 2D Close Below $0.072 = Bearish Confirmation
> ⚠️ As long as price remains between these two areas, XPL is still in a compression phase and the next direction has not been fully confirmed. A breakout or breakdown confirmed by a 2D candle close would provide a much stronger confirmation of the next major move.
#XPL #Plasma #XPLUSDT #Crypto #CryptoAnalysis #TechnicalAnalysis #Altcoins #AltcoinAnalysis #CryptoTrading #PriceAction #Breakout

✅ Get Free Signals! Join Our Telegram Channel Here: t.me/TheCryptoNuclear
✅ Twitter: twitter.com/crypto_nuclear
✅ Join Bybit : partner.bybit.com/b/nuclearvip
✅ Benefits : Lifetime Trading Fee Discount -50%
✅ Twitter: twitter.com/crypto_nuclear
✅ Join Bybit : partner.bybit.com/b/nuclearvip
✅ Benefits : Lifetime Trading Fee Discount -50%
免責事項
これらの情報および投稿は、TradingViewが提供または承認する金融、投資、取引、またはその他の種類の助言もしくは推奨であることを意図したものではなく、またこれらに該当するものでもありません。詳細は利用規約をご覧ください。
✅ Get Free Signals! Join Our Telegram Channel Here: t.me/TheCryptoNuclear
✅ Twitter: twitter.com/crypto_nuclear
✅ Join Bybit : partner.bybit.com/b/nuclearvip
✅ Benefits : Lifetime Trading Fee Discount -50%
✅ Twitter: twitter.com/crypto_nuclear
✅ Join Bybit : partner.bybit.com/b/nuclearvip
✅ Benefits : Lifetime Trading Fee Discount -50%
免責事項
これらの情報および投稿は、TradingViewが提供または承認する金融、投資、取引、またはその他の種類の助言もしくは推奨であることを意図したものではなく、またこれらに該当するものでもありません。詳細は利用規約をご覧ください。