
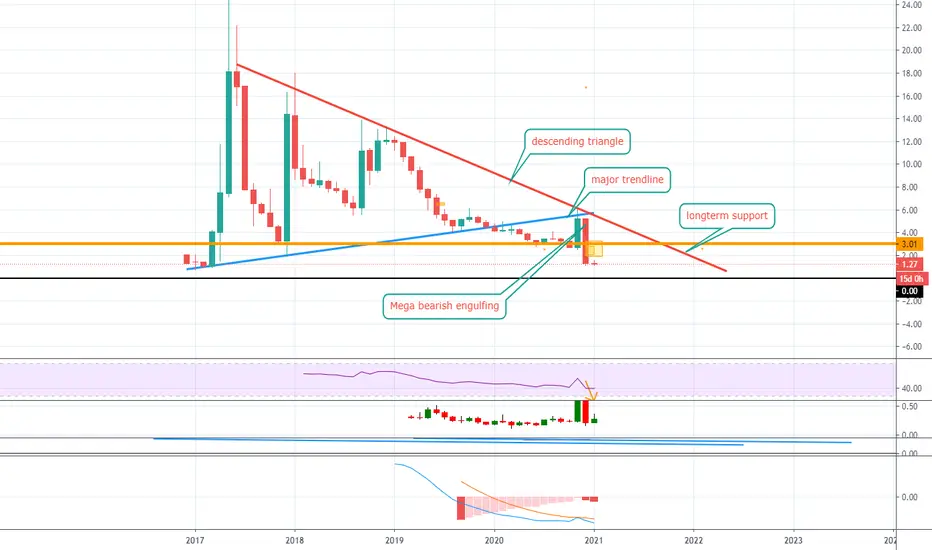
Never saw a more bearish chart and this is the monthly. Here goes:
-Dom rejected from descending triangle resistance.
-Dom fell under long-term rising trendline
-Dom monthly closed way below major longterm horizontal support.
-Mega bearish engulfing monthly candle, almost 70% larger than the bullish candle.
-MACD has been in the red forever.
How is bullish?
-Dom rejected from descending triangle resistance.
-Dom fell under long-term rising trendline
-Dom monthly closed way below major longterm horizontal support.
-Mega bearish engulfing monthly candle, almost 70% larger than the bullish candle.
-MACD has been in the red forever.
How is bullish?

関連の投稿
免責事項
これらの情報および投稿は、TradingViewが提供または承認する金融、投資、取引、またはその他の種類の助言もしくは推奨であることを意図したものではなく、またこれらに該当するものでもありません。詳細は利用規約をご覧ください。
関連の投稿
免責事項
これらの情報および投稿は、TradingViewが提供または承認する金融、投資、取引、またはその他の種類の助言もしくは推奨であることを意図したものではなく、またこれらに該当するものでもありません。詳細は利用規約をご覧ください。