
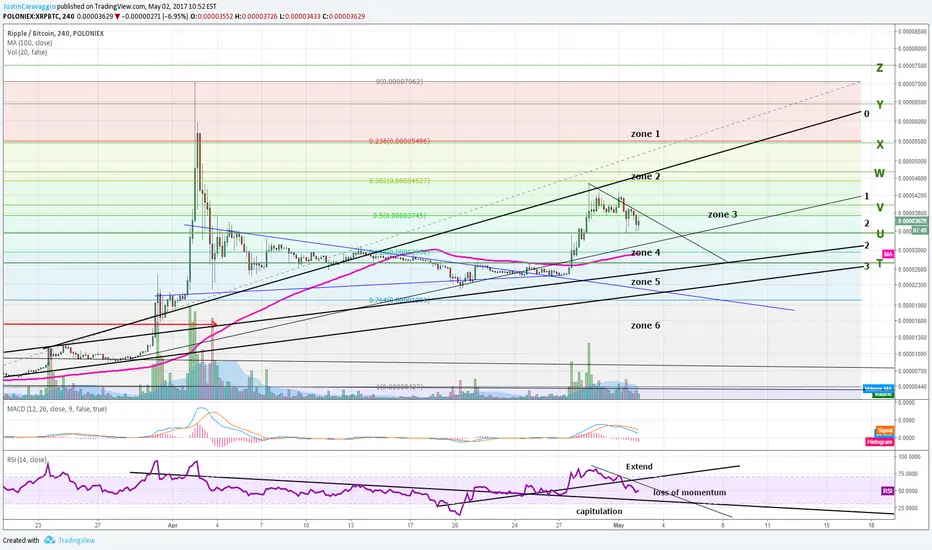
Ripple is forming support along long term support level (green line U) and also forming a triangle pattern. As bitcoin pumps higher, I suspect diagonal support line 1 will be tested, followed by the 62% retracement, green support line T and the 100 day moving average, followed by support line 2. Touching support line 2 would represent a more than 20% correction.
RSI has dipped below its bullish trendline. Lets watch to see if it can rebound off the bearish trendline.
Long term bullish on XRP
RSI has dipped below its bullish trendline. Lets watch to see if it can rebound off the bearish trendline.
Long term bullish on XRP

免責事項
これらの情報および投稿は、TradingViewが提供または承認する金融、投資、取引、またはその他の種類の助言もしくは推奨であることを意図したものではなく、またこれらに該当するものでもありません。詳細は利用規約をご覧ください。
免責事項
これらの情報および投稿は、TradingViewが提供または承認する金融、投資、取引、またはその他の種類の助言もしくは推奨であることを意図したものではなく、またこれらに該当するものでもありません。詳細は利用規約をご覧ください。