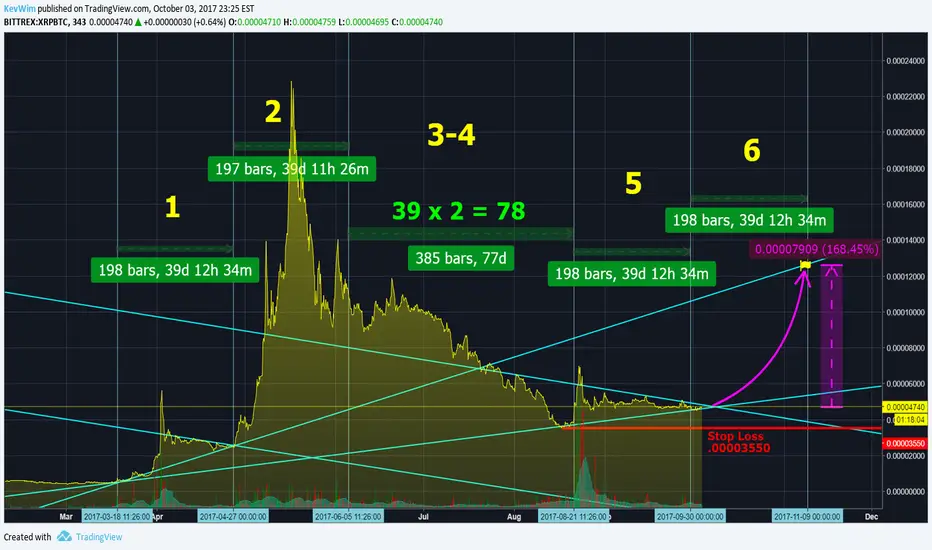
Ripple seems to be in a pattern of major activity happening in periods of about 39 days. When we divide up the chart, this is expressly evident. We have just completed a 39 day cycle and are at major trendline support with all short, medium, and even long term moving averages converging to a single point. WHAT DOES THIS MEAN? It means that the energy for Ripple's next move has been building and is ready to be UNLEASHED!!! With solid support no lower than .00003550, we can anticipate a bullish breakout with 150%+ profit potential. Happy Trading!
BitcoinWealthBuilders.com
Follow on YouTube: youtube.com/channel/UCqgxj1mStOtaI1b2-qVDihQ
Journey to $1K a Day: youtube.com/watch?v=SkpZ88yWkv0
Earn up to 40% per month on your Bitcoin: bit.ly/GoBitConnect
BitcoinWealthBuilders.com
Follow on YouTube: youtube.com/channel/UCqgxj1mStOtaI1b2-qVDihQ
Journey to $1K a Day: youtube.com/watch?v=SkpZ88yWkv0
Earn up to 40% per month on your Bitcoin: bit.ly/GoBitConnect

免責事項
これらの情報および投稿は、TradingViewが提供または承認する金融、投資、取引、またはその他の種類の助言もしくは推奨であることを意図したものではなく、またこれらに該当するものでもありません。詳細は利用規約をご覧ください。
免責事項
これらの情報および投稿は、TradingViewが提供または承認する金融、投資、取引、またはその他の種類の助言もしくは推奨であることを意図したものではなく、またこれらに該当するものでもありません。詳細は利用規約をご覧ください。