
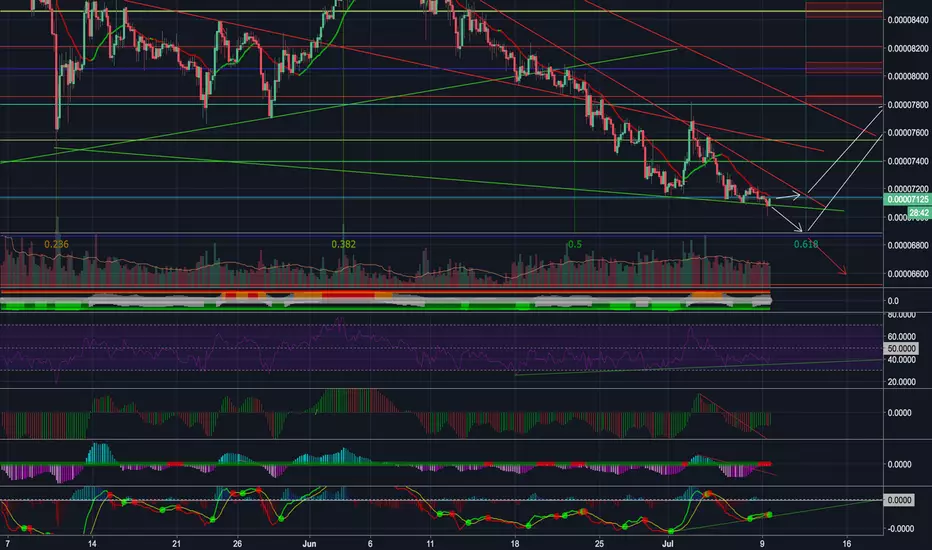
Hey guys. I'm back with another TA, this time on Ripple! Looking at the 4 hour chart, we can see that XRP has been forming a falling wedge pattern since its highs back in May. Time fibs show that another move may be upon us as we reach the apex of that wedge, signaling a strong move on the 12th of July. Looking at the RSI, we can see that XRP has been showing bullish divergence since it dropped to 8000 sats, failing to make lower lows as price has continued to fall. This bullish divergence is paired with MACD bullish divergence and buy signals crossing on both the AO and TTM Squeeze, which is also squeezing. I've outlined three routes XRP can take from here; go sideways and break out, drop down to 6900 to double bottom and then break out, or fall to 6900 and break through to make lower lows.
Now, my trade setup:
Enter 6900-7150 or on the break of the falling wedge
Stop Loss below 6900 double bottom (3% risk from 7110)
Targets are 7550, 7800, 8050, 8460, 8725 and 8950 short term; 9125, 9425, 9600, 10000, 10130, 11000, 12230, 12400 and 12710 midterm; 13560, 14800, 17600, 18400, 21800, 23000 long term

免責事項
これらの情報および投稿は、TradingViewが提供または承認する金融、投資、取引、またはその他の種類の助言もしくは推奨であることを意図したものではなく、またこれらに該当するものでもありません。詳細は利用規約をご覧ください。
免責事項
これらの情報および投稿は、TradingViewが提供または承認する金融、投資、取引、またはその他の種類の助言もしくは推奨であることを意図したものではなく、またこれらに該当するものでもありません。詳細は利用規約をご覧ください。