
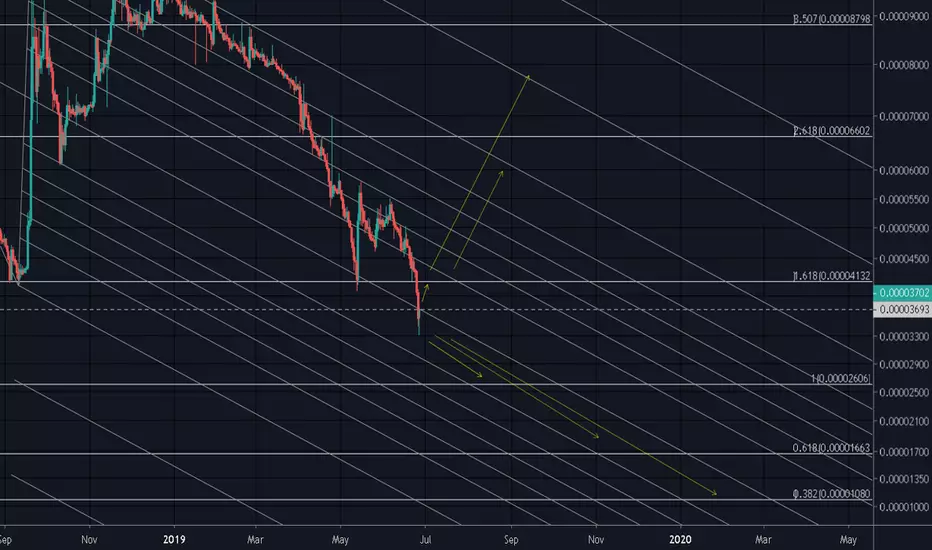
Currently it's testing resistance 3700 if it's could break it, more likely to test 4000 satoshi. If somehow the price action could closes above that price.. it's bullish sign for XRP/BTC reversal trend. Conversely, fail to retain above 3700 satoshi it will slowly move down toward next important support around 2606 satoshi.
Indicator looks bearish overall but you could notice a bullish divergence on particular indicator like MFI and Macd line is sighted on daily chart.

peace.
Indicator looks bearish overall but you could notice a bullish divergence on particular indicator like MFI and Macd line is sighted on daily chart.
peace.
ノート
IF this inverse scallop pattern work.. we will see around 2600 satoshi would be a target. ノート
Fun Fact : Today is the first time ever on 2019 when XRP/BTC manage to get 4 green candle in the row.. Keep em cummin bois!

免責事項
これらの情報および投稿は、TradingViewが提供または承認する金融、投資、取引、またはその他の種類の助言もしくは推奨であることを意図したものではなく、またこれらに該当するものでもありません。詳細は利用規約をご覧ください。
免責事項
これらの情報および投稿は、TradingViewが提供または承認する金融、投資、取引、またはその他の種類の助言もしくは推奨であることを意図したものではなく、またこれらに該当するものでもありません。詳細は利用規約をご覧ください。