
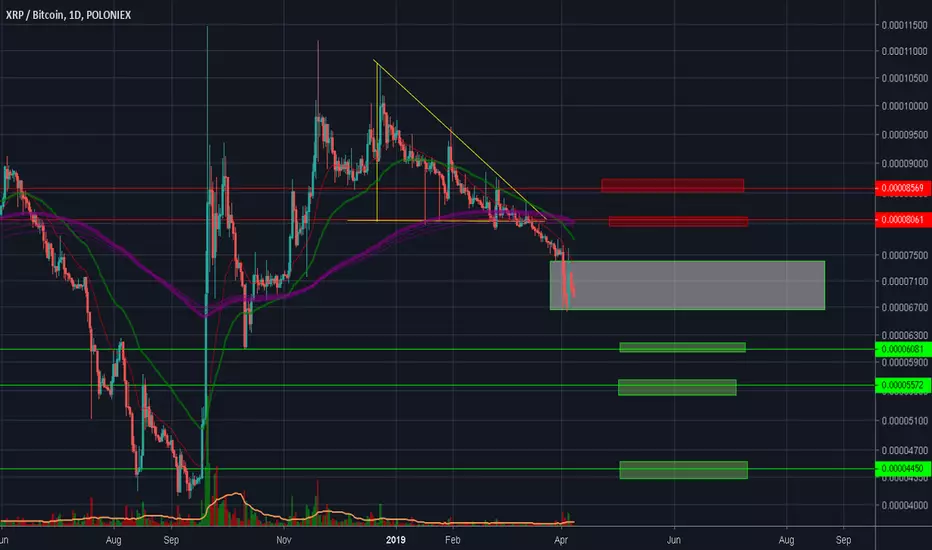
After the price action cannot manage to get through 200 EMA line.. 8200 satoshi.. The downtrend is confirmed by the downward price movement and break the descending triangle toward bearish area.
from stochastic RSI and MACD shown a continuation of downward trend ;


Support #1 : +- 6100 satoshi
Support #2 : +- 5500 satoshi
Resistance #1 : +- 8000 satoshi
Resistance #2 : +- 8500 satoshi
please let me share what your thought/idea/chart about this idea in the comment section..
peace
from stochastic RSI and MACD shown a continuation of downward trend ;
Support #1 : +- 6100 satoshi
Support #2 : +- 5500 satoshi
Resistance #1 : +- 8000 satoshi
Resistance #2 : +- 8500 satoshi
please let me share what your thought/idea/chart about this idea in the comment section..
peace
ノート
This is a important trend line from december 2017 until today XRP/BTC.. cant wait what is going to happen for XRP/BTC
関連の投稿
免責事項
これらの情報および投稿は、TradingViewが提供または承認する金融、投資、取引、またはその他の種類の助言もしくは推奨であることを意図したものではなく、またこれらに該当するものでもありません。詳細は利用規約をご覧ください。
免責事項
これらの情報および投稿は、TradingViewが提供または承認する金融、投資、取引、またはその他の種類の助言もしくは推奨であることを意図したものではなく、またこれらに該当するものでもありません。詳細は利用規約をご覧ください。