
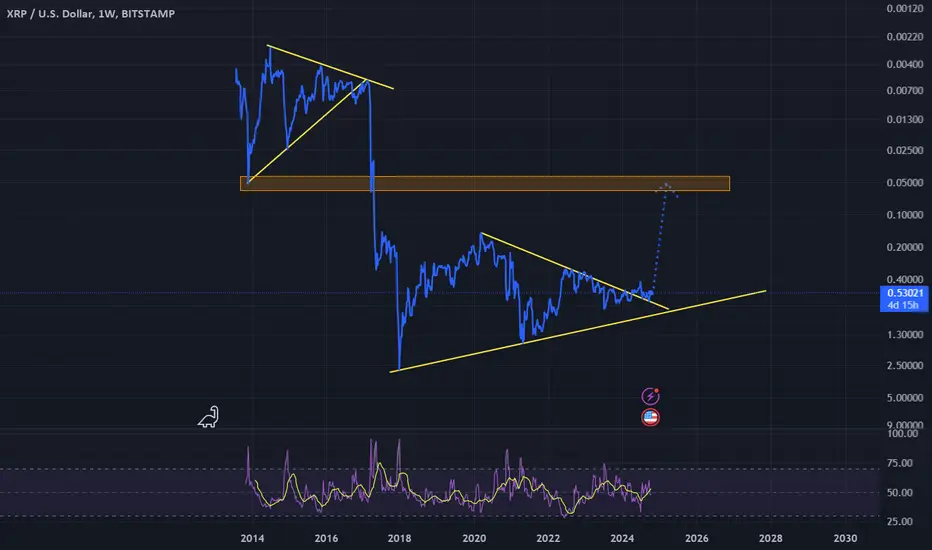
1. Log Scale:
Using a log scale can help visualize price changes more effectively, especially for assets with high volatility like XRP. It makes percentage changes clearer and can help identify trends over time.
2. Line Chart:
A line chart can provide a smoother view of price movements, making it easier to see overall trends without the noise of price fluctuations seen in candlestick charts.
3. Invert Chart:
Inverting the chart can offer a different perspective on price movements, allowing for potential insights into future price behavior based on historical patterns.
4. Trend Line:
Drawing trend lines can help identify key support and resistance levels by connecting significant highs or lows, providing a visual tool for predicting future movements.
5. Support Line:
If you're predicting XRP may reach around $0.04, it could be useful to analyze past support levels and market conditions that led to similar price points to validate this expectation.
Using a log scale can help visualize price changes more effectively, especially for assets with high volatility like XRP. It makes percentage changes clearer and can help identify trends over time.
2. Line Chart:
A line chart can provide a smoother view of price movements, making it easier to see overall trends without the noise of price fluctuations seen in candlestick charts.
3. Invert Chart:
Inverting the chart can offer a different perspective on price movements, allowing for potential insights into future price behavior based on historical patterns.
4. Trend Line:
Drawing trend lines can help identify key support and resistance levels by connecting significant highs or lows, providing a visual tool for predicting future movements.
5. Support Line:
If you're predicting XRP may reach around $0.04, it could be useful to analyze past support levels and market conditions that led to similar price points to validate this expectation.

免責事項
これらの情報および投稿は、TradingViewが提供または承認する金融、投資、取引、またはその他の種類の助言もしくは推奨であることを意図したものではなく、またこれらに該当するものでもありません。詳細は利用規約をご覧ください。
免責事項
これらの情報および投稿は、TradingViewが提供または承認する金融、投資、取引、またはその他の種類の助言もしくは推奨であることを意図したものではなく、またこれらに該当するものでもありません。詳細は利用規約をご覧ください。