
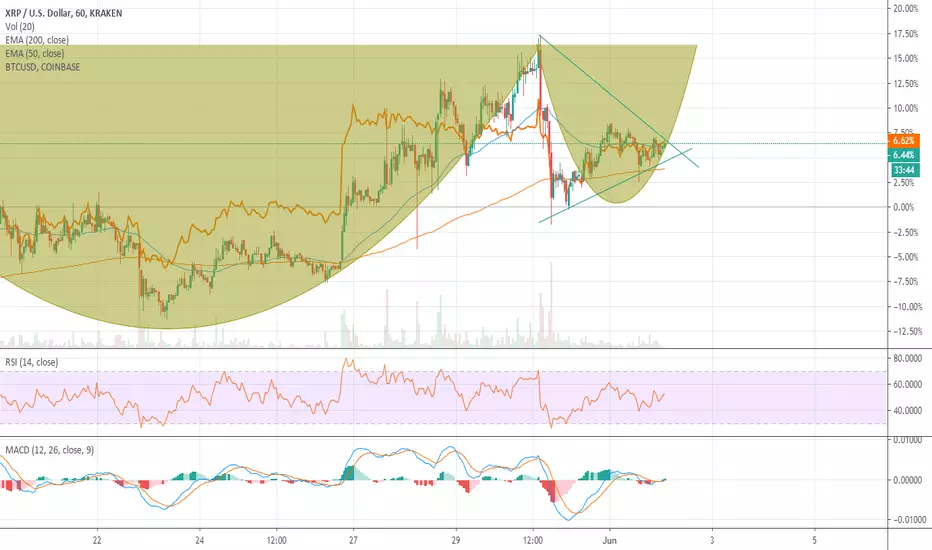
Looking at the one hour graph here on XRP
If you take a looksee at the graph above the difference in price between highs and lows seems to be diminishing, possible breakthrough from the wedge?
Would follow the prediction of the cup and handle as shown above.
RSI & MACD seem to be at a turning point, MACD line above the signal line which signals positive growth.
However volume isn't looking great compared to past shots in price,
Therefore this breakthrough will most likely depend on what bitcoin will do next (shown in orange), which also seems to be in a pretty strong position for an uptrend.
- not financial advice, just analysing what I see
If you take a looksee at the graph above the difference in price between highs and lows seems to be diminishing, possible breakthrough from the wedge?
Would follow the prediction of the cup and handle as shown above.
RSI & MACD seem to be at a turning point, MACD line above the signal line which signals positive growth.
However volume isn't looking great compared to past shots in price,
Therefore this breakthrough will most likely depend on what bitcoin will do next (shown in orange), which also seems to be in a pretty strong position for an uptrend.
- not financial advice, just analysing what I see
ノート
chart failed - onto the next
免責事項
これらの情報および投稿は、TradingViewが提供または承認する金融、投資、取引、またはその他の種類の助言もしくは推奨であることを意図したものではなく、またこれらに該当するものでもありません。詳細は利用規約をご覧ください。
免責事項
これらの情報および投稿は、TradingViewが提供または承認する金融、投資、取引、またはその他の種類の助言もしくは推奨であることを意図したものではなく、またこれらに該当するものでもありません。詳細は利用規約をご覧ください。