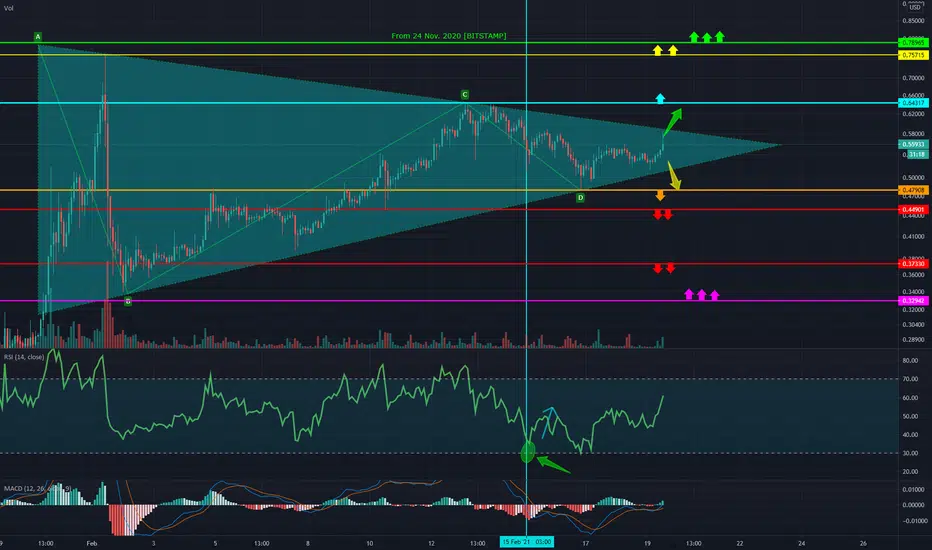
XRP has now formed a somewhat bullish triangle. Calling a bullish one simply because of where the price has entered from, which is from the bottom. Even though it looks like a bullish triangle right now, the price can fall downwards. If it falls down through, we will be seeing a lower targets (orange, red and purple support lines). If price decides to go down, we could most likely fall through orange and possibly two red support lines, where then a purple one could reverse the price upwards again.
On the other hand, if we brake upwards from the triangle we have to break above blue resistence line to start getting some real bullish signs.

 XRPUSD
On the other hand, if we brake upwards from the triangle we have to break above blue resistence line to start getting some real bullish signs.
XRPUSDノート
On a 15min chart we can see a nice bullish pennant being formed as of now.
免責事項
これらの情報および投稿は、TradingViewが提供または承認する金融、投資、取引、またはその他の種類の助言もしくは推奨であることを意図したものではなく、またこれらに該当するものでもありません。詳細は利用規約をご覧ください。
免責事項
これらの情報および投稿は、TradingViewが提供または承認する金融、投資、取引、またはその他の種類の助言もしくは推奨であることを意図したものではなく、またこれらに該当するものでもありません。詳細は利用規約をご覧ください。