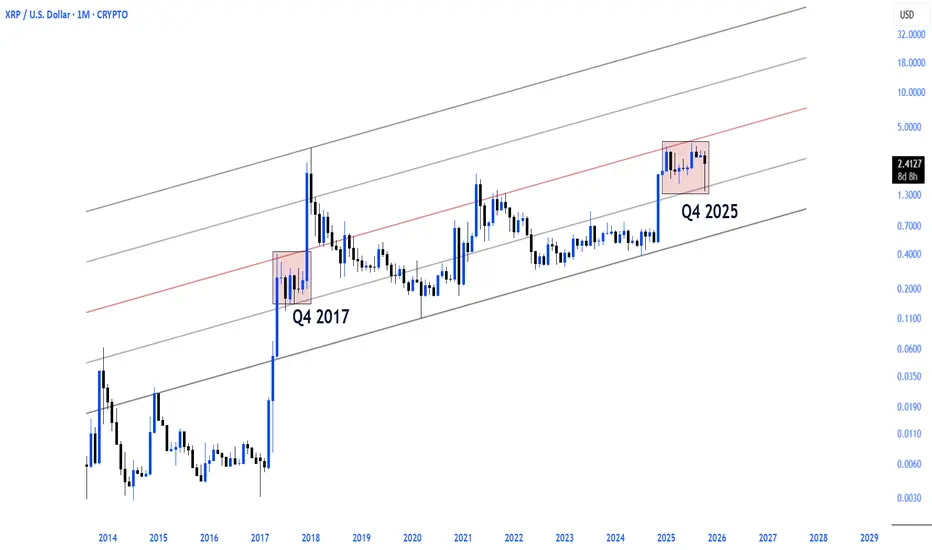
Q4 2017 After breaking the middle band of the channel, XRP peaked in a parabolic rise within a few months.
Q4 2025 In the same channel structure, the price again touched the middle band, was rejected, and then began to accumulate.
The chart shows an almost exact repetition of the technical position before the 2017 breakout.
Q4 2025 In the same channel structure, the price again touched the middle band, was rejected, and then began to accumulate.
The chart shows an almost exact repetition of the technical position before the 2017 breakout.
トレード稼働中
 XRP 🔃
XRP 🔃Ripple continues to mirror its 2017 setup.
The structure remains intact, with accumulation deepening right below the breakout zone, just like before the last parabolic run.
Patience here could be key.

免責事項
これらの情報および投稿は、TradingViewが提供または承認する金融、投資、取引、またはその他の種類の助言もしくは推奨であることを意図したものではなく、またこれらに該当するものでもありません。詳細は利用規約をご覧ください。
免責事項
これらの情報および投稿は、TradingViewが提供または承認する金融、投資、取引、またはその他の種類の助言もしくは推奨であることを意図したものではなく、またこれらに該当するものでもありません。詳細は利用規約をご覧ください。