
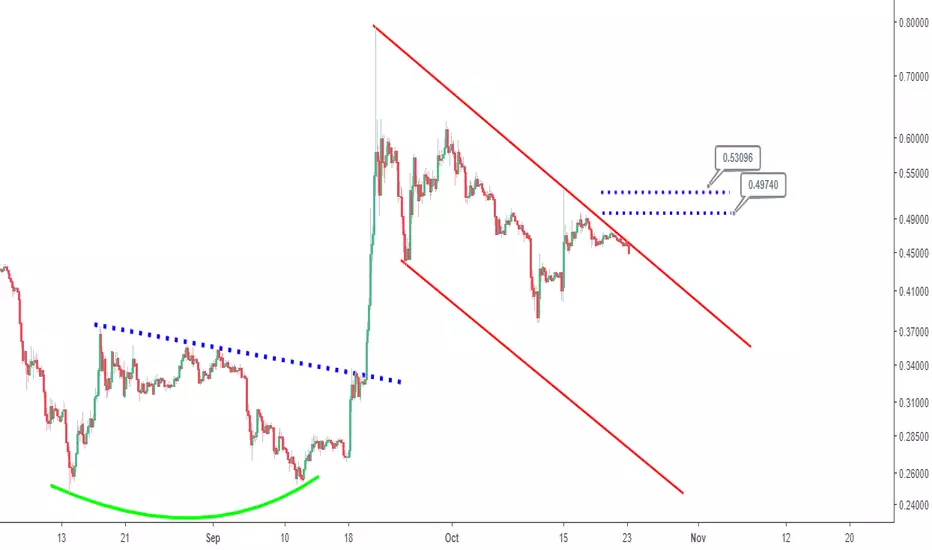
August 14, 2018 to September 20, 2018 marked the formation of a confirmed double bottom chart pattern in Ripple (XRP). Price action after confirmation reached a high of ~$0.79 before the current retracement that is captured with a bearish channel considered to be tentative.
Price action breaking to the upside of the bear channel and also above resistance as indicated by the horizontal blue lines does argue for a bullish bias for Ripple (XRP).
Price action breaking to the upside of the bear channel and also above resistance as indicated by the horizontal blue lines does argue for a bullish bias for Ripple (XRP).

関連の投稿
免責事項
これらの情報および投稿は、TradingViewが提供または承認する金融、投資、取引、またはその他の種類の助言もしくは推奨であることを意図したものではなく、またこれらに該当するものでもありません。詳細は利用規約をご覧ください。
関連の投稿
免責事項
これらの情報および投稿は、TradingViewが提供または承認する金融、投資、取引、またはその他の種類の助言もしくは推奨であることを意図したものではなく、またこれらに該当するものでもありません。詳細は利用規約をご覧ください。