
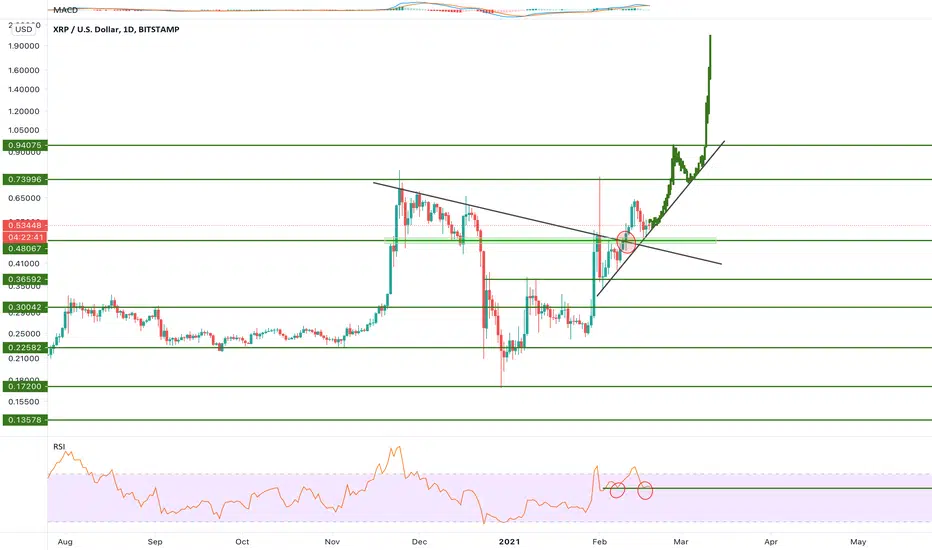
I have found many interesting thing here. 1.) We broke the important trendline last week (the red ellipse)☑️ 2.) We are in uptrend right now ☑️3.) We had to back test the support level 0.475-0.49 to check if it holds and we have done it, but we have to close a weekly candle above it to be 100% sure.☑️ 4.) We have made double bottom in RSI and it’s a good sign. ☑️5.) Next week we are ready to test the resistance 0.75, once we get above it the next resistance is 0.94-0.96. I think this is going to happen likely, so be patient and don’t panic 🙌🏼

免責事項
これらの情報および投稿は、TradingViewが提供または承認する金融、投資、取引、またはその他の種類の助言もしくは推奨であることを意図したものではなく、またこれらに該当するものでもありません。詳細は利用規約をご覧ください。
免責事項
これらの情報および投稿は、TradingViewが提供または承認する金融、投資、取引、またはその他の種類の助言もしくは推奨であることを意図したものではなく、またこれらに該当するものでもありません。詳細は利用規約をご覧ください。