
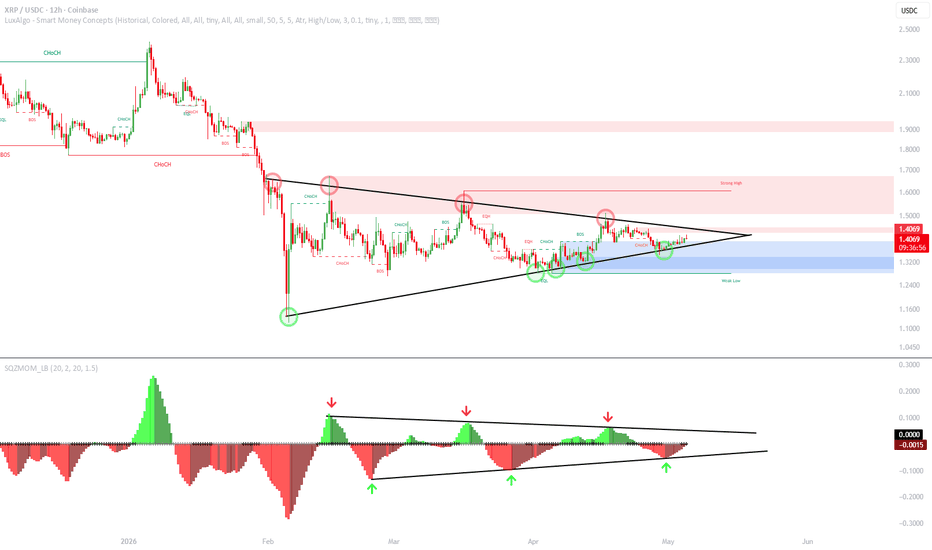
This is an update to my last idea:
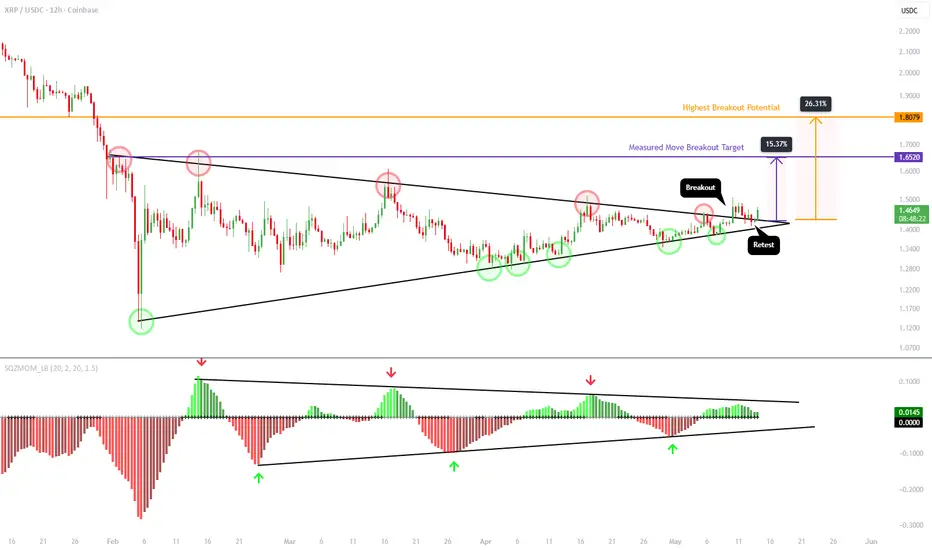
On May 5th I published that idea pointing out XRP was preparing for a massive breakout or breakdown from its symmetrical triangle. On May 9th the breakout occurred, followed by a bullish retest on May 11th-12th. XRP did close one 12H candle below the upper black trendline but immediately reversed and closed back above it on the very next candle, signaling a successful retest with no reclaim of the pattern below.
This gives price two upside targets.
The first and primary target is the measured move for XRP, which puts price back around $1.61-$1.65. This is the first level to watch for any profit taking.
If price is able to push higher, the highest I see XRP reaching with this breakout rally is the $1.77 to $1.81 level. This was first established as significant support all the way back in February 2025 and held as a major support level until it broke below on January 30, 2026. That old liquidity zone of significant demand will now act as a meaningful supply level for offloading and profit taking if price is able to rally back up to that region. It is also worth noting that the $1.77 level is the 0.5 Fibonacci of the current trend.
The good news is price can still see another 10 to 20% move to the upside even from current levels. But once price does reach those upside targets, watch closely how market participants react. If sellers start unloading at those levels that will be your signal that the breakout move for this particular pattern has come to an end.
One other thing to keep in mind, if for whatever reason, price sees a massive reversal back to the downside and closes below the lower black trendline then that would be an invalidation of this idea and breakout. Seems unlikely at the current moment, but something to keep in the back of your mind.
On May 5th I published that idea pointing out XRP was preparing for a massive breakout or breakdown from its symmetrical triangle. On May 9th the breakout occurred, followed by a bullish retest on May 11th-12th. XRP did close one 12H candle below the upper black trendline but immediately reversed and closed back above it on the very next candle, signaling a successful retest with no reclaim of the pattern below.
This gives price two upside targets.
The first and primary target is the measured move for XRP, which puts price back around $1.61-$1.65. This is the first level to watch for any profit taking.
If price is able to push higher, the highest I see XRP reaching with this breakout rally is the $1.77 to $1.81 level. This was first established as significant support all the way back in February 2025 and held as a major support level until it broke below on January 30, 2026. That old liquidity zone of significant demand will now act as a meaningful supply level for offloading and profit taking if price is able to rally back up to that region. It is also worth noting that the $1.77 level is the 0.5 Fibonacci of the current trend.
The good news is price can still see another 10 to 20% move to the upside even from current levels. But once price does reach those upside targets, watch closely how market participants react. If sellers start unloading at those levels that will be your signal that the breakout move for this particular pattern has come to an end.
One other thing to keep in mind, if for whatever reason, price sees a massive reversal back to the downside and closes below the lower black trendline then that would be an invalidation of this idea and breakout. Seems unlikely at the current moment, but something to keep in the back of your mind.

免責事項
これらの情報および投稿は、TradingViewが提供または承認する金融、投資、取引、またはその他の種類の助言もしくは推奨であることを意図したものではなく、またこれらに該当するものでもありません。詳細は利用規約をご覧ください。
免責事項
これらの情報および投稿は、TradingViewが提供または承認する金融、投資、取引、またはその他の種類の助言もしくは推奨であることを意図したものではなく、またこれらに該当するものでもありません。詳細は利用規約をご覧ください。