
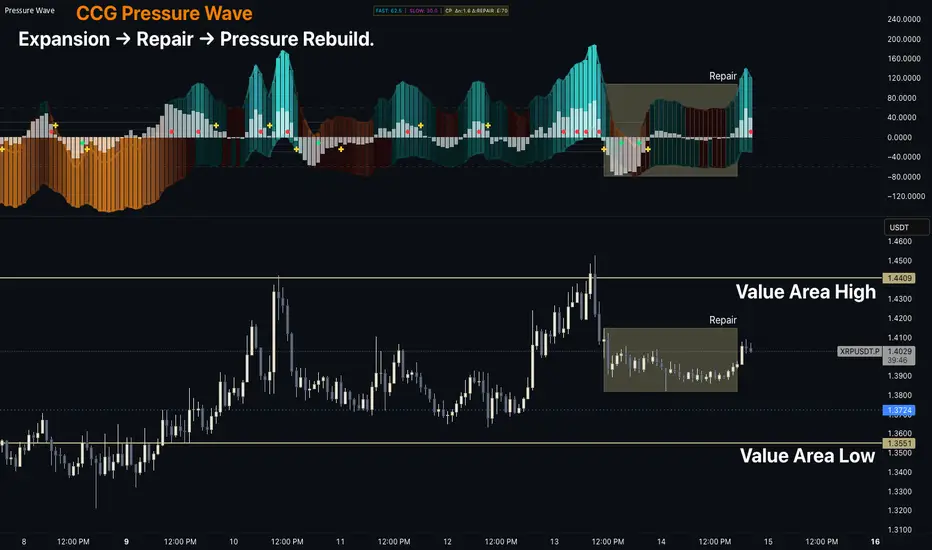
Markets rarely move in straight lines. Most impulses are followed by a repair phase where price compresses and participation cools.
In this example, price enters a range near Value Area High while Pressure Wave shows pressure contracting and flattening — a sign the market is digesting the prior move rather than committing to a new one.
As the range matures, pressure begins rebuilding internally before price attempts to move again. This shift in participation is what Pressure Wave is designed to visualize.
The goal isn’t prediction — it’s clarity.
Seeing when pressure is expanding, repairing, or rebuilding helps traders better understand the current phase of the auction.
In this example, price enters a range near Value Area High while Pressure Wave shows pressure contracting and flattening — a sign the market is digesting the prior move rather than committing to a new one.
As the range matures, pressure begins rebuilding internally before price attempts to move again. This shift in participation is what Pressure Wave is designed to visualize.
The goal isn’t prediction — it’s clarity.
Seeing when pressure is expanding, repairing, or rebuilding helps traders better understand the current phase of the auction.

Confluence Command Group | TradingView tools and chart lessons
ccgtradingllc.com
ccgtradingllc.com
免責事項
これらの情報および投稿は、TradingViewが提供または承認する金融、投資、取引、またはその他の種類の助言もしくは推奨であることを意図したものではなく、またこれらに該当するものでもありません。詳細は利用規約をご覧ください。
Confluence Command Group | TradingView tools and chart lessons
ccgtradingllc.com
ccgtradingllc.com
免責事項
これらの情報および投稿は、TradingViewが提供または承認する金融、投資、取引、またはその他の種類の助言もしくは推奨であることを意図したものではなく、またこれらに該当するものでもありません。詳細は利用規約をご覧ください。