
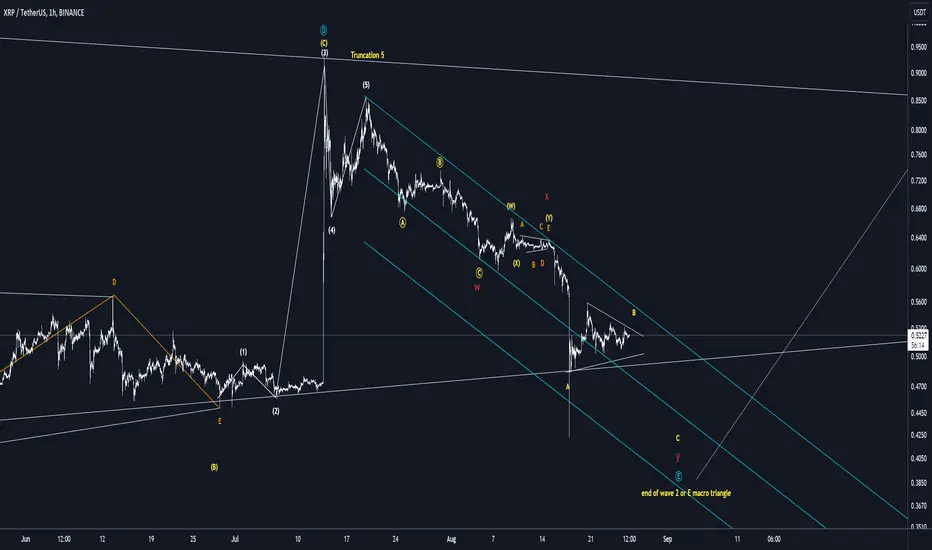
Double zig zag is in the play in my opinion.
Switching the perspective to line chart gives better clarity because of the wickery.
Just as having the wick above the (5), it might happen that we wont have a lower low point on XRP for ultimate bottom.
Btc drops once again, and pulls everything with it, and if it finally bottoms , we might see the Bullrun, hopefully not a foolsrun.
Switching the perspective to line chart gives better clarity because of the wickery.
Just as having the wick above the (5), it might happen that we wont have a lower low point on XRP for ultimate bottom.
Btc drops once again, and pulls everything with it, and if it finally bottoms , we might see the Bullrun, hopefully not a foolsrun.
ノート
Trend line holding. Line and candle chart are trying to decipher the story of potential bottom.
Btc still hesitant on its movement. Carefull with shorts here on XRP. Bottom is near.
ノート
Smaller time frame, thinking short opportunity.

免責事項
これらの情報および投稿は、TradingViewが提供または承認する金融、投資、取引、またはその他の種類の助言もしくは推奨であることを意図したものではなく、またこれらに該当するものでもありません。詳細は利用規約をご覧ください。
免責事項
これらの情報および投稿は、TradingViewが提供または承認する金融、投資、取引、またはその他の種類の助言もしくは推奨であることを意図したものではなく、またこれらに該当するものでもありません。詳細は利用規約をご覧ください。