
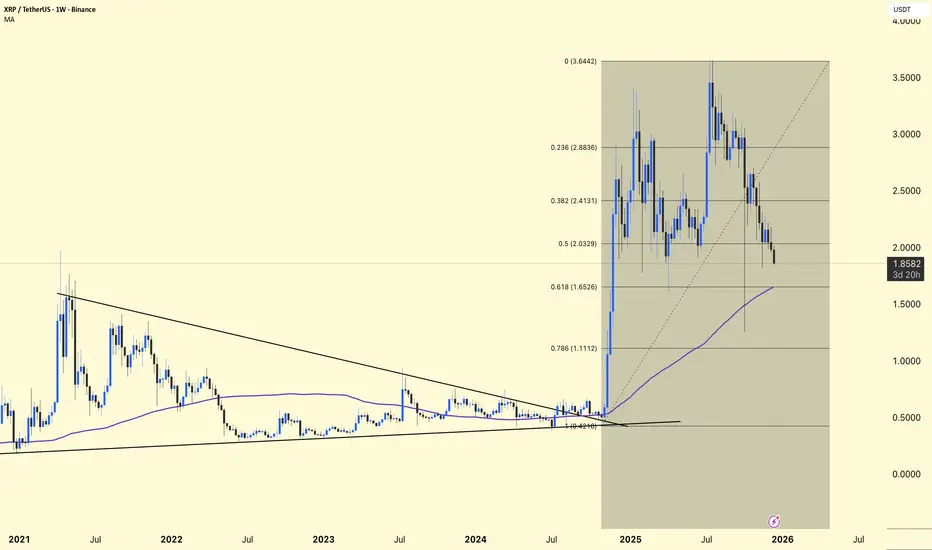
XRP/USDT – Chart Analysis (Weekly)
XRP has broken out of a multi-year downtrend line → confirming a major trend reversal
Strong impulsive rally after prolonged accumulation
The current price action is a healthy corrective pullback, not a bearish reversal
As long as the higher support zones hold, the structure remains bullish.
Fibonacci Analysis.
(Fibonacci drawn from macro low → to recent high)
0.236 – 2.88 → Strong rejection zone (local top)
0.382 – 2.41 → Supply / Resistance
0.5 – 2.03 → Mid-range level
0.618 – 1.65 → Golden Support Zone
0.786 – 1.11 → Strong demand and last bullish defense
The price is currently trading between 0.5 and 0.618, close to a high-probability demand zone.
Moving Average Confirmation
The price is still above the rising weekly MA (~1.65)
The MA is acting as dynamic support
In a bull cycle, the price often dips below the MA and recovers
As long as the weekly closes remain near/above the MA, the bullish trend remains intact.
DYOR | NFA.
XRP has broken out of a multi-year downtrend line → confirming a major trend reversal
Strong impulsive rally after prolonged accumulation
The current price action is a healthy corrective pullback, not a bearish reversal
As long as the higher support zones hold, the structure remains bullish.
Fibonacci Analysis.
(Fibonacci drawn from macro low → to recent high)
0.236 – 2.88 → Strong rejection zone (local top)
0.382 – 2.41 → Supply / Resistance
0.5 – 2.03 → Mid-range level
0.618 – 1.65 → Golden Support Zone
0.786 – 1.11 → Strong demand and last bullish defense
The price is currently trading between 0.5 and 0.618, close to a high-probability demand zone.
Moving Average Confirmation
The price is still above the rising weekly MA (~1.65)
The MA is acting as dynamic support
In a bull cycle, the price often dips below the MA and recovers
As long as the weekly closes remain near/above the MA, the bullish trend remains intact.
DYOR | NFA.

関連の投稿
免責事項
これらの情報および投稿は、TradingViewが提供または承認する金融、投資、取引、またはその他の種類の助言もしくは推奨であることを意図したものではなく、またこれらに該当するものでもありません。詳細は利用規約をご覧ください。
関連の投稿
免責事項
これらの情報および投稿は、TradingViewが提供または承認する金融、投資、取引、またはその他の種類の助言もしくは推奨であることを意図したものではなく、またこれらに該当するものでもありません。詳細は利用規約をご覧ください。