
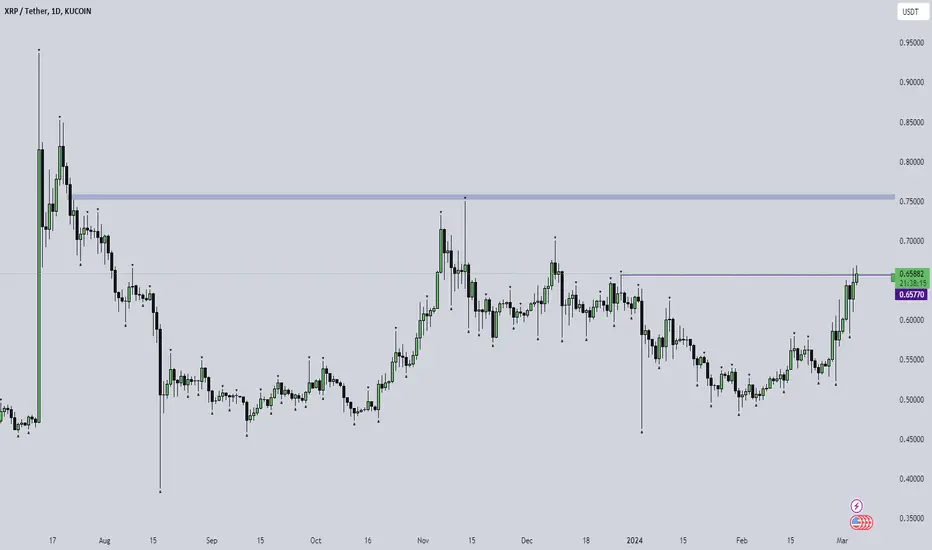
Looking at the XRP/USDT Daily Time Frame, we can get an idea where and WHY price is moving the way it is:
But WAIT .... There's More!
Pine Script®
- We see that ALL previous buyside has been swept.
- This should indicate BULLISH order flow.
- Every bullrun hits it's breaking point but where will that be???
- We see that there's more Buyside that's yet to be swept and I'm thinking it will sweep them soon in the near future.
But WAIT .... There's More!
- Right above the highest high, there is a GORGEOUS Daily SIBI resting right above.
- Sadly, it hasn't been tapped yet :(
- If it gets tapped, will XRP rise or will that be it's Downfall???
- There's only one way to find out ;)
- I'm patiently waiting for potential opportunities that allow a solid 2:1 RR trade to be taken.

免責事項
これらの情報および投稿は、TradingViewが提供または承認する金融、投資、取引、またはその他の種類の助言もしくは推奨であることを意図したものではなく、またこれらに該当するものでもありません。詳細は利用規約をご覧ください。
免責事項
これらの情報および投稿は、TradingViewが提供または承認する金融、投資、取引、またはその他の種類の助言もしくは推奨であることを意図したものではなく、またこれらに該当するものでもありません。詳細は利用規約をご覧ください。