
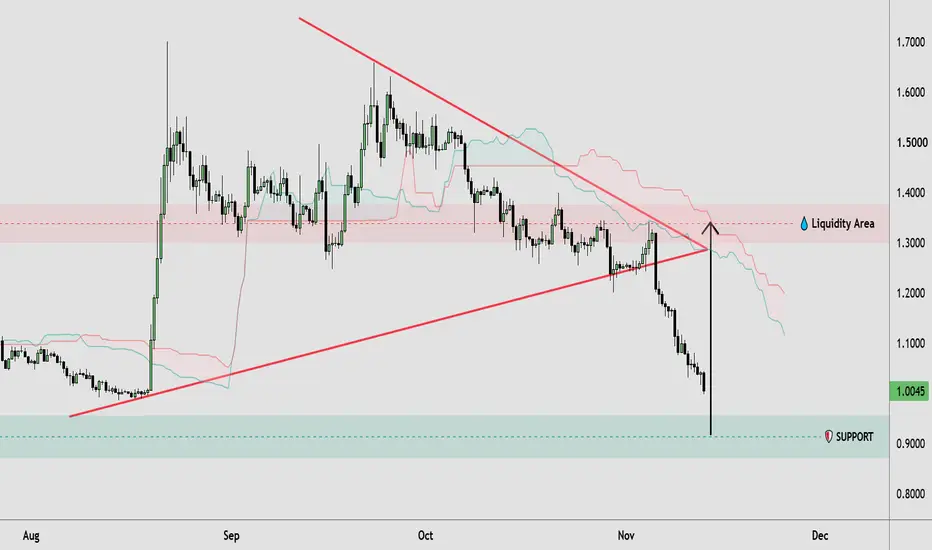
🔹 **XRPUSDT** has experienced a sharp bearish breakdown below its rising support trendline, confirming a shift in market structure from consolidation to bearish momentum. The price has also broken out of the contracting triangle pattern, with sellers maintaining control after repeated rejections along descending resistance. The previous liquidity area around 1.30–1.37 now appears to act as overhead resistance, while price continues to approach the highlighted support zone around 0.87–0.96.
🔸 The highlighted support zone could become an important reaction area where buyers may attempt a recovery. If XRPUSDT shows strong bullish price action and reclaims broken trendline support, a corrective move toward previous resistance could develop. However, traders may wait for clear price confirmation before considering any trade. If the support zone fails to hold, further bearish continuation and a deeper downside move could remain possible. This technical analysis focuses on the evolving XRP market structure and key liquidity levels.
*This analysis is for educational purposes only and does not constitute financial or investment advice. Always conduct your own research before making trading decisions.*
🔸 The highlighted support zone could become an important reaction area where buyers may attempt a recovery. If XRPUSDT shows strong bullish price action and reclaims broken trendline support, a corrective move toward previous resistance could develop. However, traders may wait for clear price confirmation before considering any trade. If the support zone fails to hold, further bearish continuation and a deeper downside move could remain possible. This technical analysis focuses on the evolving XRP market structure and key liquidity levels.
*This analysis is for educational purposes only and does not constitute financial or investment advice. Always conduct your own research before making trading decisions.*
トレード稼働中

📲 Join Our Telegram Community
t.me/+TA9wLW8l7ywxNmVk
t.me/+TA9wLW8l7ywxNmVk
関連の投稿
免責事項
これらの情報および投稿は、TradingViewが提供または承認する金融、投資、取引、またはその他の種類の助言もしくは推奨であることを意図したものではなく、またこれらに該当するものでもありません。詳細は利用規約をご覧ください。
📲 Join Our Telegram Community
t.me/+TA9wLW8l7ywxNmVk
t.me/+TA9wLW8l7ywxNmVk
関連の投稿
免責事項
これらの情報および投稿は、TradingViewが提供または承認する金融、投資、取引、またはその他の種類の助言もしくは推奨であることを意図したものではなく、またこれらに該当するものでもありません。詳細は利用規約をご覧ください。