
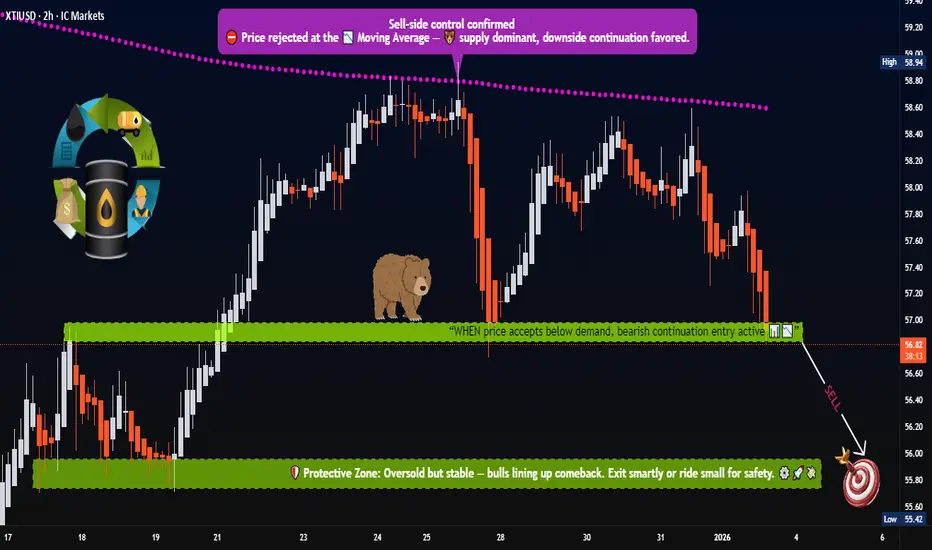
🔻 XTI/USD (WTI / USOIL) — Bearish Breakout Trade Blueprint
Energies Market | Day / Swing Trade Opportunity
📌 Asset Overview
XTI/USD – WTI Crude Oil vs U.S. Dollar
Market Type: Energy Commodity (CFD / Futures correlated)
Trading Style: Day Trade / Swing Trade
🧭 Trade Plan
🔴 Primary Bias: BEARISH BREAKOUT CONTINUATION
Price has completed a structure breakdown, confirming seller dominance after failed bullish recovery. Momentum favors downside continuation as liquidity shifts below key levels.
🎯 Entry Strategy
📍 Sell AFTER confirmed breakout below → 56.80
• You may enter at any price level after breakout confirmation
• Aggressive traders: enter on breakdown momentum
• Conservative traders: wait for a pullback retest below 56.80
Execution depends on your risk model & position sizing.
🛑 Stop Loss (Risk Control)
🚨 Protective SL: 58.00
⚠️ This is a reference level, not a mandatory rule.
Adjust your stop placement based on:
Timeframe
Volatility
Account risk parameters
🎯 Profit Objective
🎯 Primary TP Zone: 55.80
Why this zone matters:
• Strong historical support
• Oversold reaction area
• High probability of short-covering
• Correction + liquidity trap zone
⚠️ Partial profits are advised as price approaches this region.
🔎 Key Technical Drivers
✔️ Breakdown below key structure
✔️ Lower highs + lower lows
✔️ Momentum shift favoring sellers
✔️ Failed bullish continuation
✔️ Liquidity sweep completed above range
🌍 Related Markets to Watch (Correlation Map)
💵 USD-Linked Instruments
DXY (U.S. Dollar Index) → Strong USD often pressures oil prices
USD/CAD → Inverse correlation (CAD = oil-linked currency)
📉 Risk & Macro Assets
US10Y Treasury Yields → Rising yields = pressure on commodities
S&P 500 / US Indices → Risk-off sentiment weighs on energy demand
🛢️ Energy Complex
Brent Crude (UKOIL) → Confirms directional bias
Energy Sector Stocks → Weakness confirms oil downside momentum
📰 Fundamental & Economic Factors Supporting This Trade
⚖️ Macro Environment
• Demand concerns from global growth slowdown
• Stronger USD reducing commodity attractiveness
• Tight financial conditions limiting speculative inflows
🛢️ Oil-Specific Factors
• Inventory sensitivity remains elevated
• Market reacts sharply to supply-demand imbalance
• Volatility increases near key economic releases
📅 Upcoming Market Sensitivities
• U.S. inflation data
• Federal Reserve policy expectations
• Energy inventory updates
• Global growth & demand outlook commentary
Expect volatility spikes around high-impact macro releases.
⚠️ Risk Disclaimer
This analysis is not financial advice.
Stop loss and take profit levels are guidelines only.
Every trader must manage risk according to their own strategy.
👍 If this analysis adds value
• Drop a LIKE 👍
• Share your view in comments 💬
• Follow for consistent energy market breakdowns 📈
Energies Market | Day / Swing Trade Opportunity
📌 Asset Overview
XTI/USD – WTI Crude Oil vs U.S. Dollar
Market Type: Energy Commodity (CFD / Futures correlated)
Trading Style: Day Trade / Swing Trade
🧭 Trade Plan
🔴 Primary Bias: BEARISH BREAKOUT CONTINUATION
Price has completed a structure breakdown, confirming seller dominance after failed bullish recovery. Momentum favors downside continuation as liquidity shifts below key levels.
🎯 Entry Strategy
📍 Sell AFTER confirmed breakout below → 56.80
• You may enter at any price level after breakout confirmation
• Aggressive traders: enter on breakdown momentum
• Conservative traders: wait for a pullback retest below 56.80
Execution depends on your risk model & position sizing.
🛑 Stop Loss (Risk Control)
🚨 Protective SL: 58.00
⚠️ This is a reference level, not a mandatory rule.
Adjust your stop placement based on:
Timeframe
Volatility
Account risk parameters
🎯 Profit Objective
🎯 Primary TP Zone: 55.80
Why this zone matters:
• Strong historical support
• Oversold reaction area
• High probability of short-covering
• Correction + liquidity trap zone
⚠️ Partial profits are advised as price approaches this region.
🔎 Key Technical Drivers
✔️ Breakdown below key structure
✔️ Lower highs + lower lows
✔️ Momentum shift favoring sellers
✔️ Failed bullish continuation
✔️ Liquidity sweep completed above range
🌍 Related Markets to Watch (Correlation Map)
💵 USD-Linked Instruments
DXY (U.S. Dollar Index) → Strong USD often pressures oil prices
USD/CAD → Inverse correlation (CAD = oil-linked currency)
📉 Risk & Macro Assets
US10Y Treasury Yields → Rising yields = pressure on commodities
S&P 500 / US Indices → Risk-off sentiment weighs on energy demand
🛢️ Energy Complex
Brent Crude (UKOIL) → Confirms directional bias
Energy Sector Stocks → Weakness confirms oil downside momentum
📰 Fundamental & Economic Factors Supporting This Trade
⚖️ Macro Environment
• Demand concerns from global growth slowdown
• Stronger USD reducing commodity attractiveness
• Tight financial conditions limiting speculative inflows
🛢️ Oil-Specific Factors
• Inventory sensitivity remains elevated
• Market reacts sharply to supply-demand imbalance
• Volatility increases near key economic releases
📅 Upcoming Market Sensitivities
• U.S. inflation data
• Federal Reserve policy expectations
• Energy inventory updates
• Global growth & demand outlook commentary
Expect volatility spikes around high-impact macro releases.
⚠️ Risk Disclaimer
This analysis is not financial advice.
Stop loss and take profit levels are guidelines only.
Every trader must manage risk according to their own strategy.
👍 If this analysis adds value
• Drop a LIKE 👍
• Share your view in comments 💬
• Follow for consistent energy market breakdowns 📈

関連の投稿
免責事項
これらの情報および投稿は、TradingViewが提供または承認する金融、投資、取引、またはその他の種類の助言もしくは推奨であることを意図したものではなく、またこれらに該当するものでもありません。詳細は利用規約をご覧ください。
関連の投稿
免責事項
これらの情報および投稿は、TradingViewが提供または承認する金融、投資、取引、またはその他の種類の助言もしくは推奨であることを意図したものではなく、またこれらに該当するものでもありません。詳細は利用規約をご覧ください。