Tezos Update After Great Profits | Chart Mapped
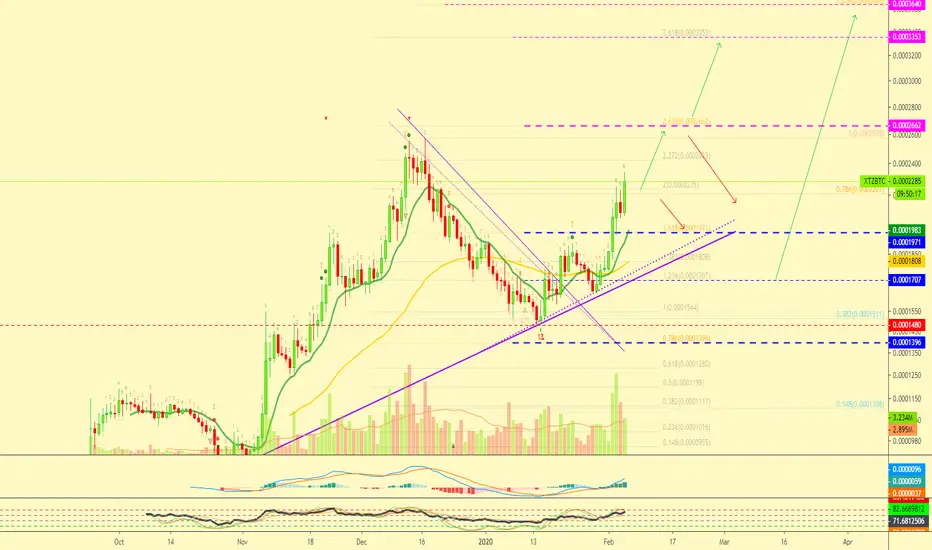
We started looking at Tezos (XTZBTC) back in 2018, but only in 2019, this altcoin pair became available for trading in many of the major exchanges.
We jumped in and Tezos treated us really well with great profits... You will find the charts at the bottom of this post.
Now, by popular request, here I mapped all of the Fibonacci target and support levels for Tezos vs Bitcoin... Blue is for support while magenta is for resistance/target.
Tezos (XTZBTC) indicators are bullish and there is room for additional growth.
Below you can find our chart from Nov. 2019 with over 120% of profits:
Another one from Oct. 1st:
We saw it coming since September 2019... This is our second ever chart for Tezos (XTZBTC):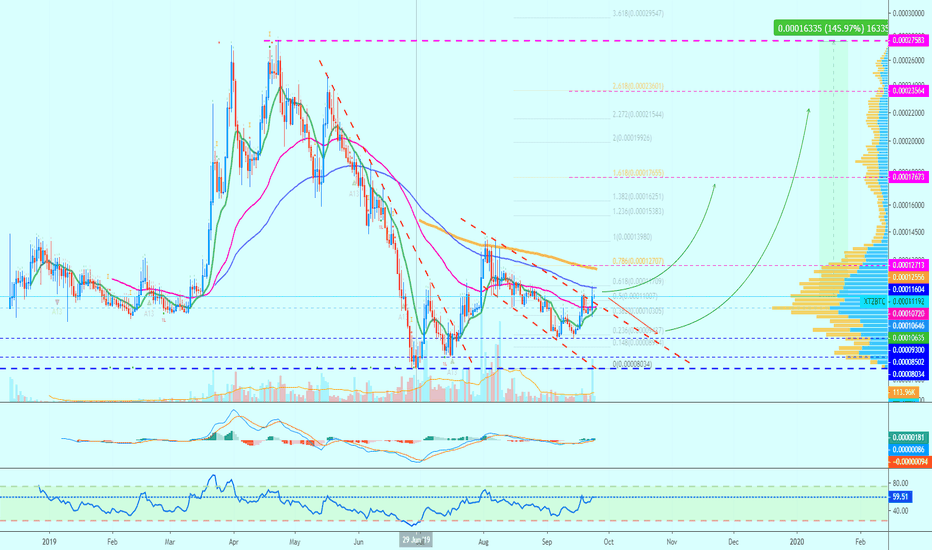
Thanks a lot for your continued support.
Remember to hit LIKE!
Namaste.
We jumped in and Tezos treated us really well with great profits... You will find the charts at the bottom of this post.
Now, by popular request, here I mapped all of the Fibonacci target and support levels for Tezos vs Bitcoin... Blue is for support while magenta is for resistance/target.
Tezos (XTZBTC) indicators are bullish and there is room for additional growth.
Below you can find our chart from Nov. 2019 with over 120% of profits:
Another one from Oct. 1st:
We saw it coming since September 2019... This is our second ever chart for Tezos (XTZBTC):
Thanks a lot for your continued support.
Remember to hit LIKE!
Namaste.

✅ Cryptocurrencies technical analysis & results
t.me/masteranandatrades/9279
✅ Stocks technical analysis
t.me/anandastocks
✅ Enjoyed the content?
Join PREMIUM channels to show your support!
t.me/lamatrades/4 (since 2017)
t.me/masteranandatrades/9279
✅ Stocks technical analysis
t.me/anandastocks
✅ Enjoyed the content?
Join PREMIUM channels to show your support!
t.me/lamatrades/4 (since 2017)
関連の投稿
免責事項
これらの情報および投稿は、TradingViewが提供または承認する金融、投資、取引、またはその他の種類の助言もしくは推奨であることを意図したものではなく、またこれらに該当するものでもありません。詳細は利用規約をご覧ください。
✅ Cryptocurrencies technical analysis & results
t.me/masteranandatrades/9279
✅ Stocks technical analysis
t.me/anandastocks
✅ Enjoyed the content?
Join PREMIUM channels to show your support!
t.me/lamatrades/4 (since 2017)
t.me/masteranandatrades/9279
✅ Stocks technical analysis
t.me/anandastocks
✅ Enjoyed the content?
Join PREMIUM channels to show your support!
t.me/lamatrades/4 (since 2017)
関連の投稿
免責事項
これらの情報および投稿は、TradingViewが提供または承認する金融、投資、取引、またはその他の種類の助言もしくは推奨であることを意図したものではなく、またこれらに該当するものでもありません。詳細は利用規約をご覧ください。