
Good morning?
Dear traders, nice to meet you.
"Like" is a huge force for me.
By "following" you can always get new information quickly.
Thank you for always supporting me.
-------------------------------------------------- -----
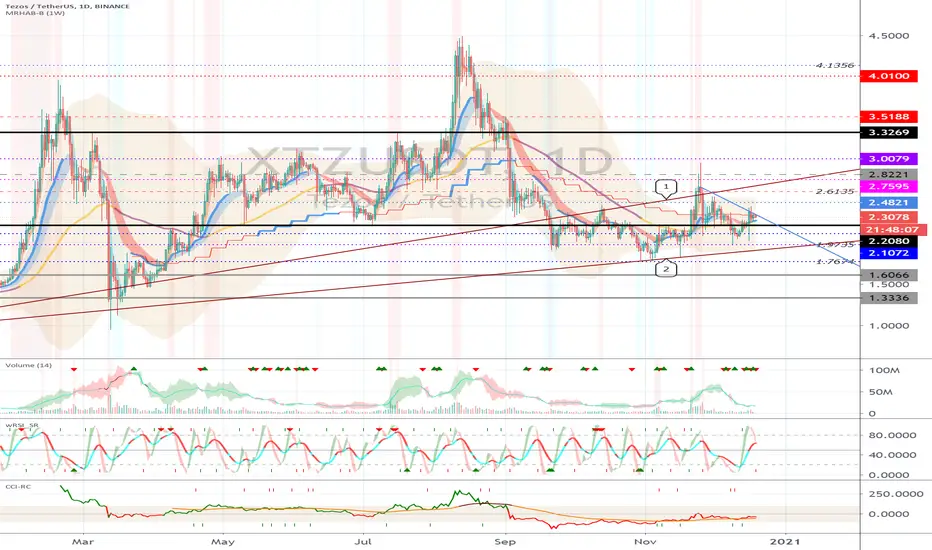
We have to see if we can get support at 2.2080 and climb above 2.4821.
If supported at 2.4821, it is a possible entry point to break above the uptrend line (1).
If it falls from the 2.2080 point, it is a short-term stop loss.
We must see if we can break above the uptrend line (1) and touch the 3.3269 point.
The key is whether it can break above the 2.8221 point.
-------------------------------------------------- -------------------------------------------
** All indicators are lagging indicators.
So, it's important to know that the indicator moves accordingly with the movement of price and volume.
Just for convenience, we are talking upside down to interpret the indicators.
** Check support, resistance, and abbreviation points.
** Support or resistance is based on the closing price of the 1D chart.
** All explanations are for reference only and do not guarantee profit or loss on investment.
Explanation of abbreviations displayed on the chart
R: A point or section of resistance that requires a response to preserve profits
S-L: Stop-Loss point or section
S: A point or segment that can be bought for profit generation as a support point or segment
(Short-term Stop Loss can be said to be a point where profits and losses can be preserved or additionally entered through installment trading. You should trade from a short-term investment perspective.)

[Practical trading strategy using HA-MS and SBOD]
youtu.be/aceN1AttX1Y
[Renko Bot]
readcrypto.kr/live
youtu.be/aceN1AttX1Y
[Renko Bot]
readcrypto.kr/live
関連の投稿
免責事項
これらの情報および投稿は、TradingViewが提供または承認する金融、投資、取引、またはその他の種類の助言もしくは推奨であることを意図したものではなく、またこれらに該当するものでもありません。詳細は利用規約をご覧ください。
[Practical trading strategy using HA-MS and SBOD]
youtu.be/aceN1AttX1Y
[Renko Bot]
readcrypto.kr/live
youtu.be/aceN1AttX1Y
[Renko Bot]
readcrypto.kr/live
関連の投稿
免責事項
これらの情報および投稿は、TradingViewが提供または承認する金融、投資、取引、またはその他の種類の助言もしくは推奨であることを意図したものではなく、またこれらに該当するものでもありません。詳細は利用規約をご覧ください。