
Hello?
Dear Traders, Nice to meet you.
"Like" is a great power for me ("Like" gives me the power to post charts).
By "following" you can always get new information quickly.
Thank you for always supporting.
--------------------------------------
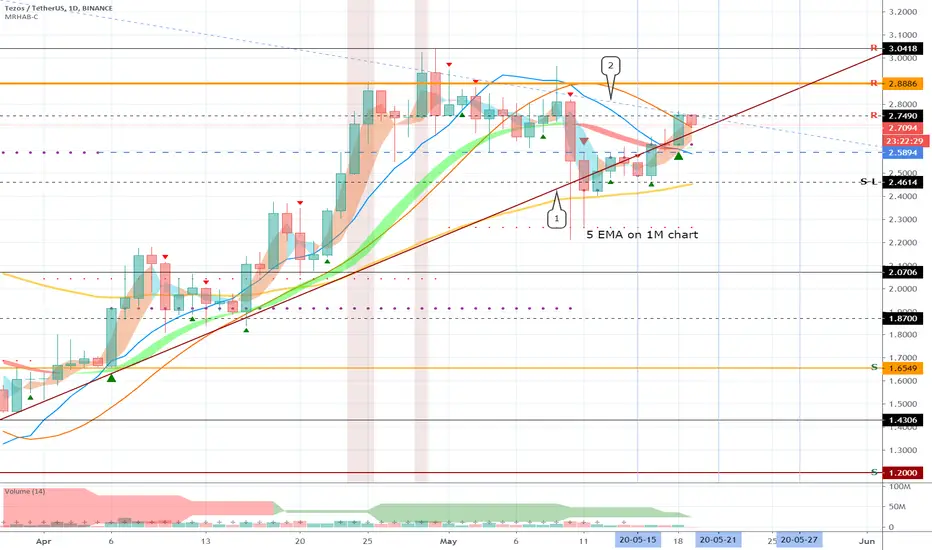
The uptrend line (1) and the downtrend line (2) intersect on May 21st.
We need to see if we can get support on the uptrend line (1) today.
You should also see if you can rise above the downtrend line (2).
After May 21st, I think it is important to be able to rise above the 2.7490 point and follow the uptrend line (1).
If it falls below the uptrend line (1), it must be supported at 2.5894.
------------------------------------------------
** Check support, resistance and abbreviation points.
** Support or resistance is based on the closing price of the 1D chart.
** All descriptions are for reference only and do not guarantee profit or loss on investment.
Description of abbreviations shown in chart
R: A resistance point or section where a response is needed to preserve revenue
S-L: Stop-Loss point or section
S: A point or section where purchase is possible to generate profits as a support point or section
Dear Traders, Nice to meet you.
"Like" is a great power for me ("Like" gives me the power to post charts).
By "following" you can always get new information quickly.
Thank you for always supporting.
--------------------------------------
The uptrend line (1) and the downtrend line (2) intersect on May 21st.
We need to see if we can get support on the uptrend line (1) today.
You should also see if you can rise above the downtrend line (2).
After May 21st, I think it is important to be able to rise above the 2.7490 point and follow the uptrend line (1).
If it falls below the uptrend line (1), it must be supported at 2.5894.
------------------------------------------------
** Check support, resistance and abbreviation points.
** Support or resistance is based on the closing price of the 1D chart.
** All descriptions are for reference only and do not guarantee profit or loss on investment.
Description of abbreviations shown in chart
R: A resistance point or section where a response is needed to preserve revenue
S-L: Stop-Loss point or section
S: A point or section where purchase is possible to generate profits as a support point or section

YouTube: youtube.com/@readcrypto9837
※ Follow X to check out the posts.
※ X를 팔로우하고 게시물을 확인하세요.
◆ t.me/readCryptoChannel
[HA-MS Indicator]
bit.ly/3YxHgvN
[OBV Indicator]
bit.ly/4dcyny3
※ Follow X to check out the posts.
※ X를 팔로우하고 게시물을 확인하세요.
◆ t.me/readCryptoChannel
[HA-MS Indicator]
bit.ly/3YxHgvN
[OBV Indicator]
bit.ly/4dcyny3
関連の投稿
免責事項
これらの情報および投稿は、TradingViewが提供または承認する金融、投資、取引、またはその他の種類の助言もしくは推奨であることを意図したものではなく、またこれらに該当するものでもありません。詳細は利用規約をご覧ください。
YouTube: youtube.com/@readcrypto9837
※ Follow X to check out the posts.
※ X를 팔로우하고 게시물을 확인하세요.
◆ t.me/readCryptoChannel
[HA-MS Indicator]
bit.ly/3YxHgvN
[OBV Indicator]
bit.ly/4dcyny3
※ Follow X to check out the posts.
※ X를 팔로우하고 게시물을 확인하세요.
◆ t.me/readCryptoChannel
[HA-MS Indicator]
bit.ly/3YxHgvN
[OBV Indicator]
bit.ly/4dcyny3
関連の投稿
免責事項
これらの情報および投稿は、TradingViewが提供または承認する金融、投資、取引、またはその他の種類の助言もしくは推奨であることを意図したものではなく、またこれらに該当するものでもありません。詳細は利用規約をご覧ください。