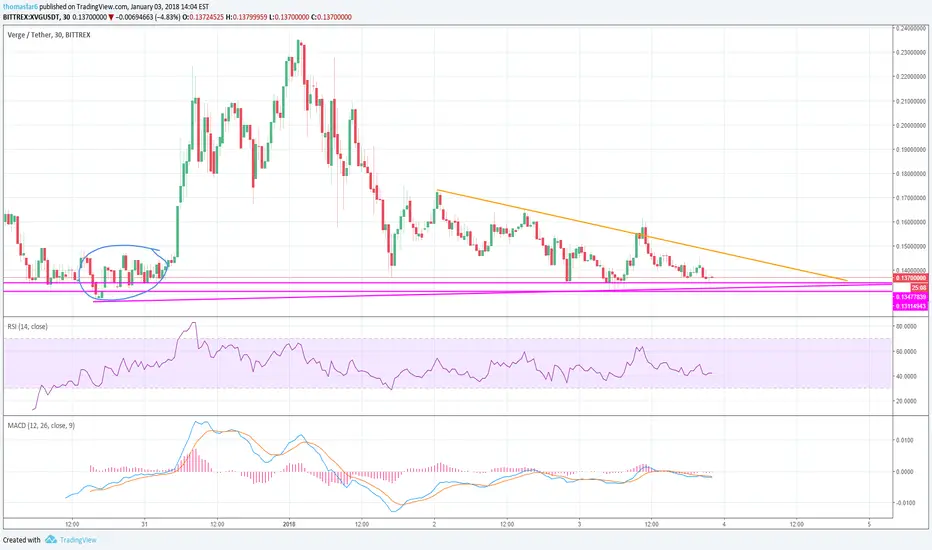
Over the past few weeks, Verge has experienced a tremendous increase in value, as the price moves parabolically. However in the recent days, we've seen reverse in price as the bearish trends begin to settle in, the chart indicates that verge is forming a descending triangle pattern which usually shows a bearish market. Unfortunately, this can signify an upcoming decrease for a further decrease.
On the positive note, These trends can sometimes reverse and result in an upside especially if the price break through the resistance that has been formed which is indicated by the orange line.
I expect the price to make a short-term reversal which can be about a 20% increase.
STOP LOSS (AIM TO PUT THEM AT THE SUPPORT LINES):
0.1325
As always trade the lines accordingly.
On the positive note, These trends can sometimes reverse and result in an upside especially if the price break through the resistance that has been formed which is indicated by the orange line.
I expect the price to make a short-term reversal which can be about a 20% increase.
STOP LOSS (AIM TO PUT THEM AT THE SUPPORT LINES):
0.1325
- MACD - Leaves room for upper growth and the lines look to be Crossing soon.
- RSI - the relative strength index shows a lot of space for upward movement compared to the potential dance.
- Orange - Resistance.
- Pink - Support.
As always trade the lines accordingly.

免責事項
これらの情報および投稿は、TradingViewが提供または承認する金融、投資、取引、またはその他の種類の助言もしくは推奨であることを意図したものではなく、またこれらに該当するものでもありません。詳細は利用規約をご覧ください。
免責事項
これらの情報および投稿は、TradingViewが提供または承認する金融、投資、取引、またはその他の種類の助言もしくは推奨であることを意図したものではなく、またこれらに該当するものでもありません。詳細は利用規約をご覧ください。