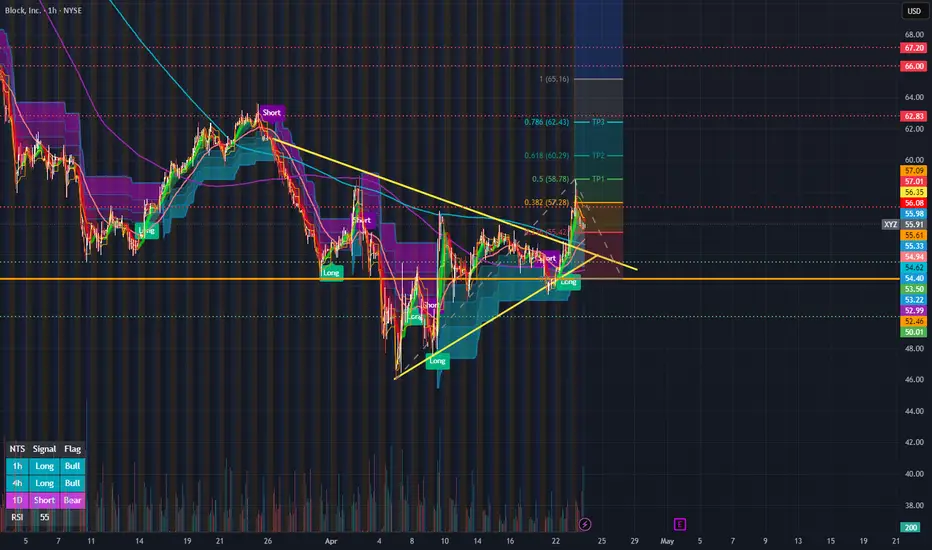
 XYZ back in bull trend here since tapping the 50 psych level. The 100WMA showing some confluence here with bull flag + trendline break from last month's disaster.
 Fibs also coincide with some of the idea here with us currently in the golden zone
Short term, I'd take a stop here below 52.50 as it can get ugly back to 50, and would consider taking another long there at 50.
For now, 53-54 range looks good for long pullback. 54.60 is the 333SMA on the 1HR chart here. Looks like a great spot for starter entries. If the pullback does not come, a break above 57 (pm highs TODAY, 4/23) should see a nice push towards 60 psych level which could see some strong resistance. Targeting 62 if we break 60.
Leaps look great here with all this confluence. Easy stop below that 50 psych.
Targets on chart are assuming we do not get a pullback tomorrow. If we do, the r/r becomes much better to the long side. This chart does not look good for bears. Options flow
Thoughts on XYZ?

免責事項
これらの情報および投稿は、TradingViewが提供または承認する金融、投資、取引、またはその他の種類の助言もしくは推奨であることを意図したものではなく、またこれらに該当するものでもありません。詳細は利用規約をご覧ください。
免責事項
これらの情報および投稿は、TradingViewが提供または承認する金融、投資、取引、またはその他の種類の助言もしくは推奨であることを意図したものではなく、またこれらに該当するものでもありません。詳細は利用規約をご覧ください。