ロング
[DAY] Elliott Waves Forecast for YFIBTC
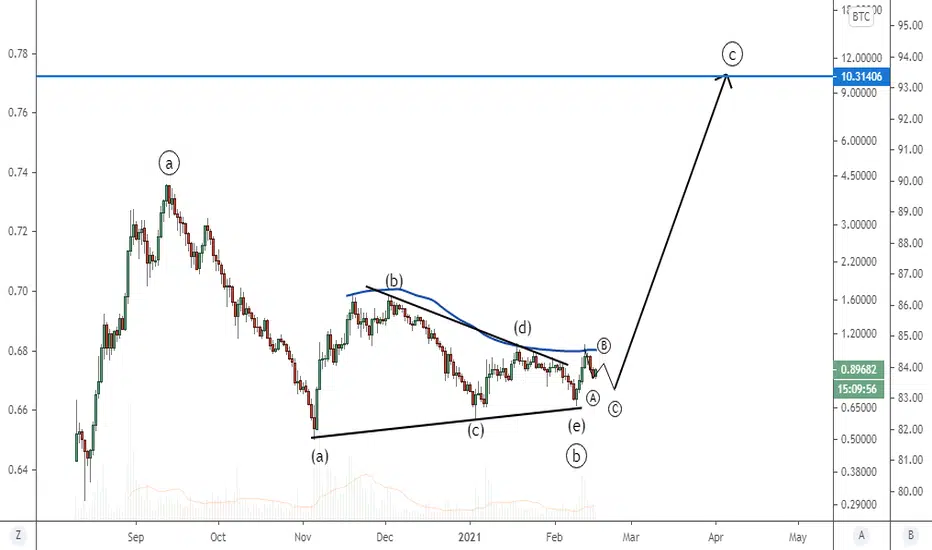
YFIBTC shows a very distinct ABCDE pattern that started on Sept 12th 2020 and ended on Feb 9th
The pair is now bullish with 5 waves swing completed on Feb 12th
Now the question remains whether the correction ended or whether we are in a B that will be followed by a C towards the 0.77 level
I prefer the second scenario considering the current choppiness of the market
At contrary if the previous high is overtaken, it would be a strong buy signal
The mid term/long term target is not well defined but in any scenario it would be of course higher than the major A
See further updates in comment section
The pair is now bullish with 5 waves swing completed on Feb 12th
Now the question remains whether the correction ended or whether we are in a B that will be followed by a C towards the 0.77 level
I prefer the second scenario considering the current choppiness of the market
At contrary if the previous high is overtaken, it would be a strong buy signal
The mid term/long term target is not well defined but in any scenario it would be of course higher than the major A
See further updates in comment section
トレード稼働中
ABC looks complete

関連の投稿
免責事項
これらの情報および投稿は、TradingViewが提供または承認する金融、投資、取引、またはその他の種類の助言もしくは推奨であることを意図したものではなく、またこれらに該当するものでもありません。詳細は利用規約をご覧ください。
免責事項
これらの情報および投稿は、TradingViewが提供または承認する金融、投資、取引、またはその他の種類の助言もしくは推奨であることを意図したものではなく、またこれらに該当するものでもありません。詳細は利用規約をご覧ください。