YFIBTC - Case for Bulls
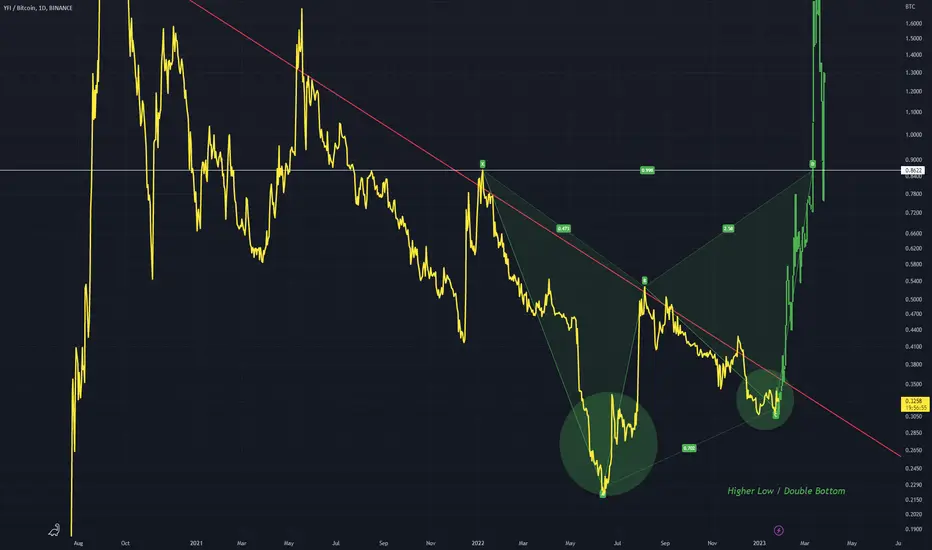
Currently this red trendline is dominant and should be considered when looking at this chart, as the dominant trend is down.
Ill give it a shot at picking the bottom though. A higher low and subsequent double bottom is a good candidate for a potential reversal
The ABCD pattern shows my thought process when looking at this chart structure
If price breaks down when the red line is hit then the bears are in control, but if it does breakout I expect it to move to D
Ill give it a shot at picking the bottom though. A higher low and subsequent double bottom is a good candidate for a potential reversal
The ABCD pattern shows my thought process when looking at this chart structure
If price breaks down when the red line is hit then the bears are in control, but if it does breakout I expect it to move to D

免責事項
これらの情報および投稿は、TradingViewが提供または承認する金融、投資、取引、またはその他の種類の助言もしくは推奨であることを意図したものではなく、またこれらに該当するものでもありません。詳細は利用規約をご覧ください。
免責事項
これらの情報および投稿は、TradingViewが提供または承認する金融、投資、取引、またはその他の種類の助言もしくは推奨であることを意図したものではなく、またこれらに該当するものでもありません。詳細は利用規約をご覧ください。