ロング
YFII/USDT 2 Hour Chart Scallop
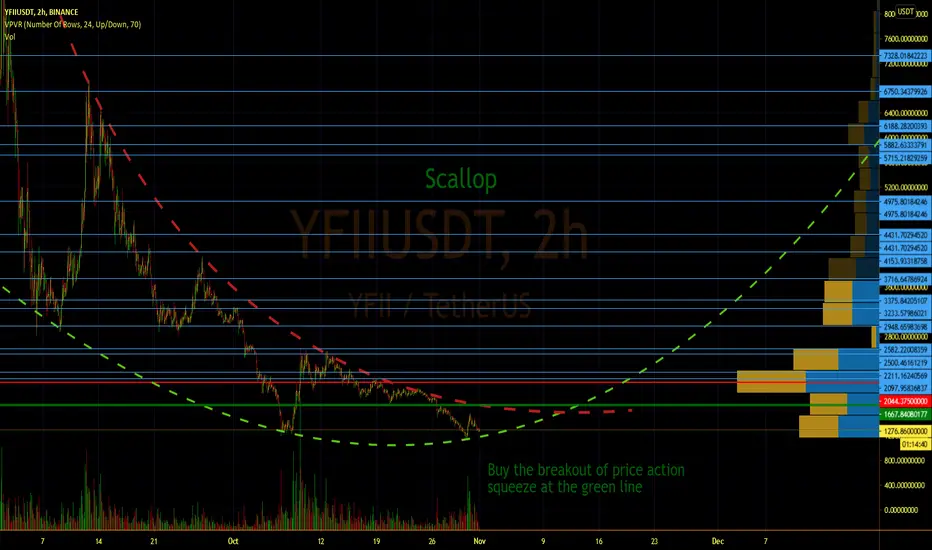
This is a clean scallop which at a minimum should regain a 65% of the overall heights the price action fell from given time. Targets are marked for take profit levels where pullbacks should take place. Green line marks safe buy in point.
ノート
Posted this back on Halloween and wanted to remind everyone we are about to approach the best entry again as we prepare for the move up the side of the scallop/cupWhat I see is a possible 1490 maybe only 1767 before movement to complete the lower time frame scallop we are currently printing by curving up and ultimately up the side of the larger time frame scallop, but anything could happen
ノート
Zoomed back ノート

免責事項
これらの情報および投稿は、TradingViewが提供または承認する金融、投資、取引、またはその他の種類の助言もしくは推奨であることを意図したものではなく、またこれらに該当するものでもありません。詳細は利用規約をご覧ください。
免責事項
これらの情報および投稿は、TradingViewが提供または承認する金融、投資、取引、またはその他の種類の助言もしくは推奨であることを意図したものではなく、またこれらに該当するものでもありません。詳細は利用規約をご覧ください。