
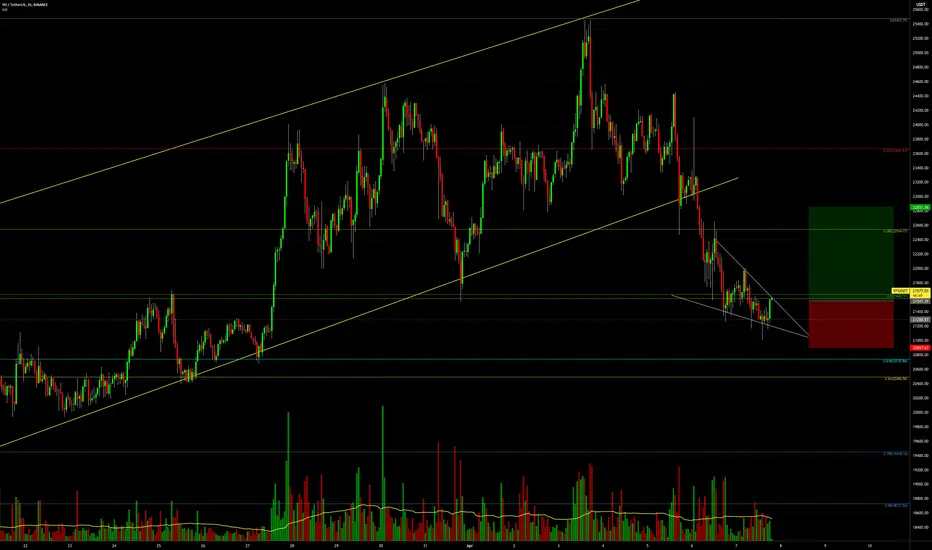
YFI/usdt (yearn.finance) price has found bullish price support and macd momentum in the 1-hour chart.
Entry (long): $21537
Take Profit +6% (exit): $22851
Stop Loss -3% (exit): $20897
Note: need to see a breakout above the descending wedge and price trend change (uptrend) on this hourly chart.
Shorter-term intraday price may pullback before this crypto eventually rallies.
YFI/usdt has less liquidity than other cryptos and more volatility.
Utilize stop loss, position sizing, risk management.
All content is Not financial advice. Trade at your own risk.
Entry (long): $21537
Take Profit +6% (exit): $22851
Stop Loss -3% (exit): $20897
Note: need to see a breakout above the descending wedge and price trend change (uptrend) on this hourly chart.
Shorter-term intraday price may pullback before this crypto eventually rallies.
YFI/usdt has less liquidity than other cryptos and more volatility.
Utilize stop loss, position sizing, risk management.
All content is Not financial advice. Trade at your own risk.
ノート
04/08/2022: YFI/usdt nearing 0.618 Fibonacci support on 1-hour chart.
Follow Me on TradingView and Youtube.
Social Media links are in my profile.
Boost, comment, share to support.
All posts are not financial advice.
Social Media links are in my profile.
Boost, comment, share to support.
All posts are not financial advice.
免責事項
これらの情報および投稿は、TradingViewが提供または承認する金融、投資、取引、またはその他の種類の助言もしくは推奨であることを意図したものではなく、またこれらに該当するものでもありません。詳細は利用規約をご覧ください。
Follow Me on TradingView and Youtube.
Social Media links are in my profile.
Boost, comment, share to support.
All posts are not financial advice.
Social Media links are in my profile.
Boost, comment, share to support.
All posts are not financial advice.
免責事項
これらの情報および投稿は、TradingViewが提供または承認する金融、投資、取引、またはその他の種類の助言もしくは推奨であることを意図したものではなく、またこれらに該当するものでもありません。詳細は利用規約をご覧ください。