
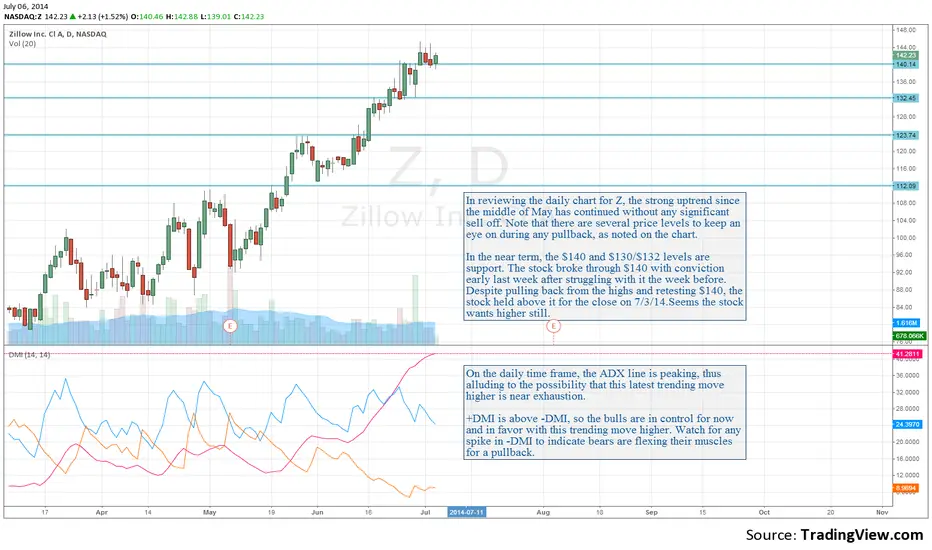
In reviewing the daily chart for Z, the strong uptrend since the middle of May has continued without any significant sell off. Note that there are several price levels to keep an eye on during any pullback, as noted on the chart.
In the near term, the $140 and $130/$132 levels are support. The stock broke through $140 with conviction early last week after struggling with it the week before. Despite pulling back from the highs and retesting $140, the stock held above it for the close on 7/3/14.Seems the stock wants higher still.
Blog post dated 07/05/2014: syncubate.com/blog/2014/7/6/zillow-trending-move-analysis
In the near term, the $140 and $130/$132 levels are support. The stock broke through $140 with conviction early last week after struggling with it the week before. Despite pulling back from the highs and retesting $140, the stock held above it for the close on 7/3/14.Seems the stock wants higher still.
Blog post dated 07/05/2014: syncubate.com/blog/2014/7/6/zillow-trending-move-analysis

免責事項
これらの情報および投稿は、TradingViewが提供または承認する金融、投資、取引、またはその他の種類の助言もしくは推奨であることを意図したものではなく、またこれらに該当するものでもありません。詳細は利用規約をご覧ください。
免責事項
これらの情報および投稿は、TradingViewが提供または承認する金融、投資、取引、またはその他の種類の助言もしくは推奨であることを意図したものではなく、またこれらに該当するものでもありません。詳細は利用規約をご覧ください。