アップデート済
ZClassic
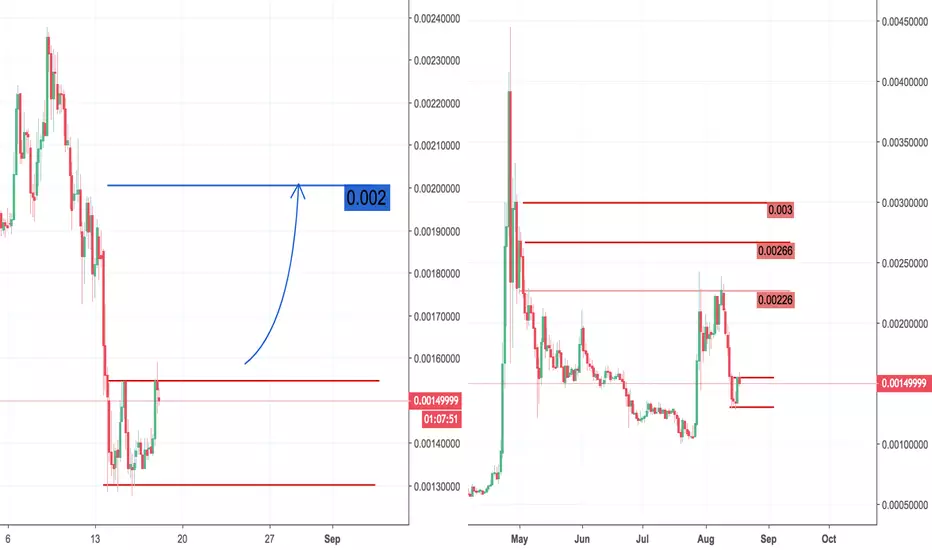
The left chart shows the trading range we are currently in. A break up would result in testing the 0.002 as a short term projection.
The right chart indicates more a long term projection. The resistance lines are shown.
Big news will follow up, until the fork happening on 10th of September.
The ANON Team will be announcing exchange markets , and some new surprises, which in my opinion will lead to the highs. Let's see :)
The right chart indicates more a long term projection. The resistance lines are shown.
Big news will follow up, until the fork happening on 10th of September.
The ANON Team will be announcing exchange markets , and some new surprises, which in my opinion will lead to the highs. Let's see :)
ノート
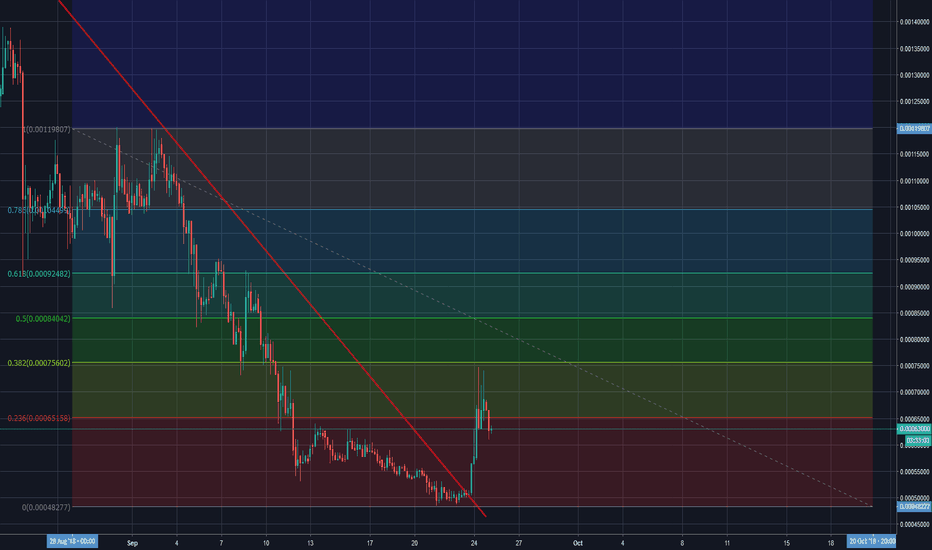

免責事項
これらの情報および投稿は、TradingViewが提供または承認する金融、投資、取引、またはその他の種類の助言もしくは推奨であることを意図したものではなく、またこれらに該当するものでもありません。詳細は利用規約をご覧ください。
免責事項
これらの情報および投稿は、TradingViewが提供または承認する金融、投資、取引、またはその他の種類の助言もしくは推奨であることを意図したものではなく、またこれらに該当するものでもありません。詳細は利用規約をご覧ください。