
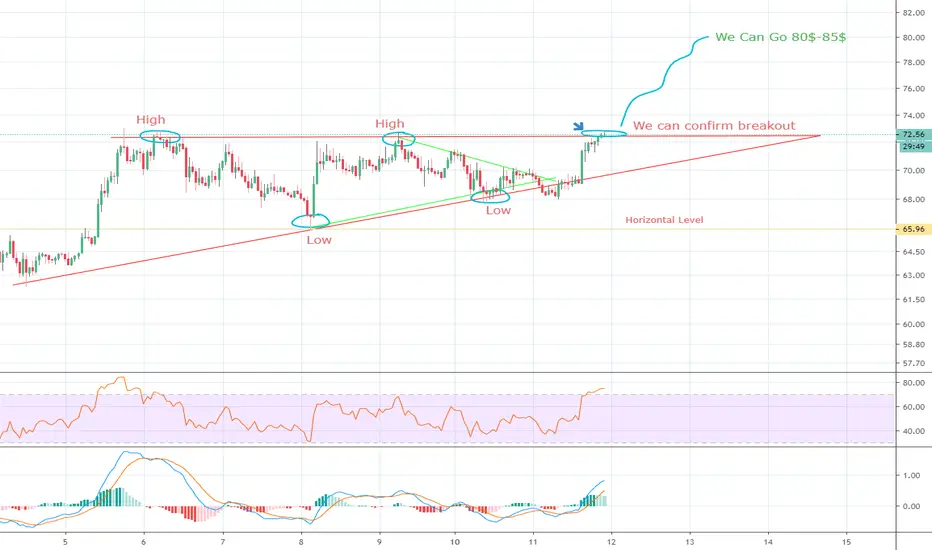
We clearly see ascending triangle pattern, and we can see HIGH-LOW and again HIGH-LOW i'm marked it blue color High poin and Low point, and we can wait for resistance to breakout to UPTrend.We see green trendline show as support level and we can breakout soon an possible, success touches trendline. Now we can see resistance level and breakout confirmed. good luck everyone :)))

免責事項
これらの情報および投稿は、TradingViewが提供または承認する金融、投資、取引、またはその他の種類の助言もしくは推奨であることを意図したものではなく、またこれらに該当するものでもありません。詳細は利用規約をご覧ください。
免責事項
これらの情報および投稿は、TradingViewが提供または承認する金融、投資、取引、またはその他の種類の助言もしくは推奨であることを意図したものではなく、またこれらに該当するものでもありません。詳細は利用規約をご覧ください。