
Hello friends
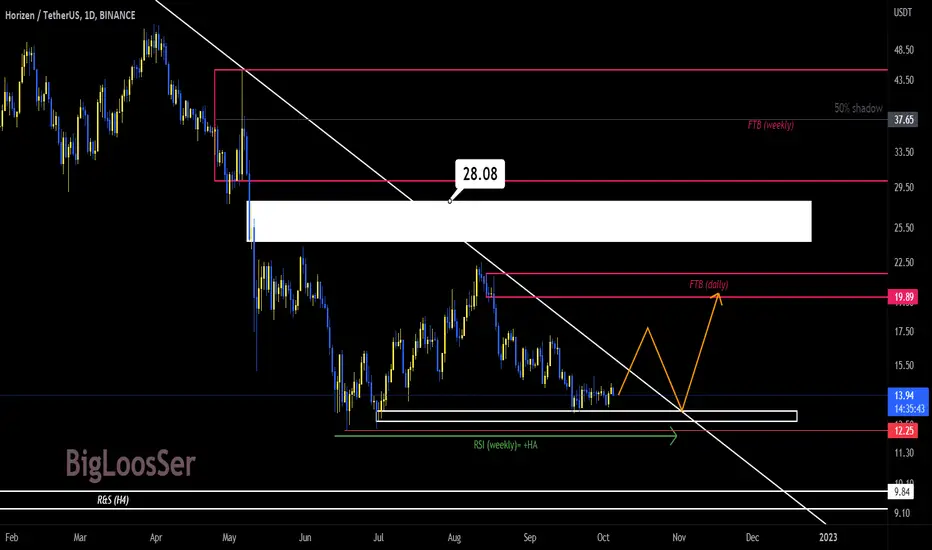
The positive divergence of the RSA in the weekly chart and the downward trend line , which the price is just below, is an interesting combination, isn't it!?
If the $12.25 range is maintained in the current trend and the upward trend is placed above the $17.2 price range, the long-term downward trend line will be broken upwards.
In this case, we can expect an increasing trend in the medium term.
What do you think?

免責事項
これらの情報および投稿は、TradingViewが提供または承認する金融、投資、取引、またはその他の種類の助言もしくは推奨であることを意図したものではなく、またこれらに該当するものでもありません。詳細は利用規約をご覧ください。
免責事項
これらの情報および投稿は、TradingViewが提供または承認する金融、投資、取引、またはその他の種類の助言もしくは推奨であることを意図したものではなく、またこれらに該当するものでもありません。詳細は利用規約をご覧ください。