ロング
ZILBTC falling wedge
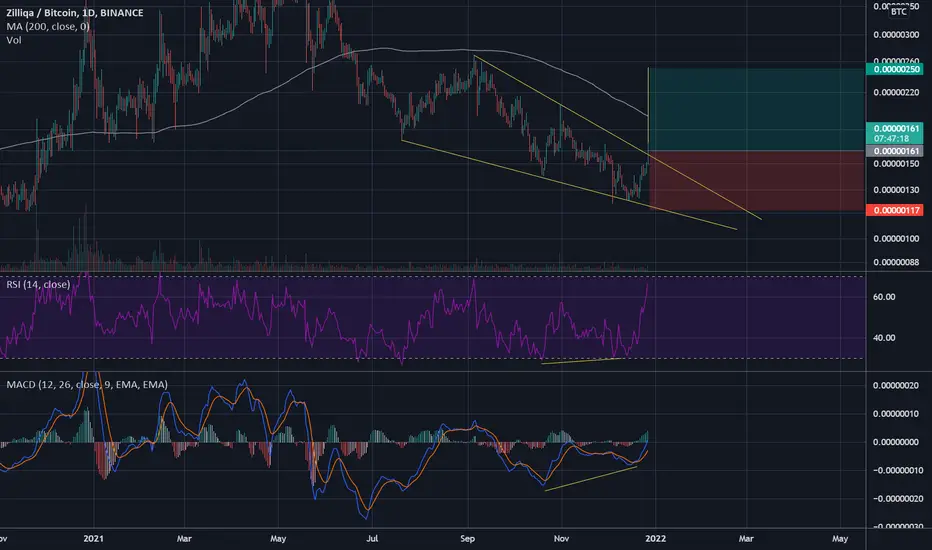
Dear Friends i have noticed falling wedge pattern forming on ZILBTC daily chart. It is a bullish pattern. The price just broke through downtrend line, volume confirms reversal also we can see bullish divergence both on MACD and RSI.
buy now at ~0.00000161
stop loss at 0.00000117
profit target at 0.00000250
risk & reward ratio 2:1
buy now at ~0.00000161
stop loss at 0.00000117
profit target at 0.00000250
risk & reward ratio 2:1
トレード終了: ストップロスに到達

免責事項
これらの情報および投稿は、TradingViewが提供または承認する金融、投資、取引、またはその他の種類の助言もしくは推奨であることを意図したものではなく、またこれらに該当するものでもありません。詳細は利用規約をご覧ください。
免責事項
これらの情報および投稿は、TradingViewが提供または承認する金融、投資、取引、またはその他の種類の助言もしくは推奨であることを意図したものではなく、またこれらに該当するものでもありません。詳細は利用規約をご覧ください。